Showing posts with label IntegraVision. Show all posts

Friday, October 30, 2015

New data logger solves the mystery of inconsistent efficiency readings

(Today’s post was written by another one of our experienced engineers, Bill Griffith. Thanks, Bill, for sharing your knowledge and this new feature with everyone!)

While measuring the efficiency of a small 12 Vdc to 115 Vac power inverter the readings fluctuated between 87.80 % and 88.70 % with a consistent load. To learn more about the efficiency, an IntegraVision Power Analyzer with its new data logging feature was used to capture efficiency over time.

The new data logger feature captures every numerical measurement from each channel over a period of time. With just two parameters to configure, the data logger is easy to use. The length of data logging can be as short as 1 second or as long as 365 days. The interval for recording data can be set as low as 50 ms to as high as 24 hours. If an interval of 200 ms or longer is selected, THD and efficiency measurements are also saved. All measurements are gapless, continuous whole cycle measurements.

Below is a graph of efficiency. As you can see the efficiency changes over time.

Efficiency is calculated from the output power divided by the input power. The data logger file contains the output and input power. Both are graphed below.


We can see the efficiency is fluctuating due to the input power. The inverter contains a small fan that turns on about every 10 seconds and increases the amount of power required.

If you are interested in seeing a video of the inverter being tested, watch this YouTube video.

A couple of final notes on using the data logger: the data logger file is a csv file; the rows are time stamped and hold the measurements for each interval. Each column is for a different measurement and a single channel can have over 30 measurements. The columns are labeled for each type of measurement and by channel. Check out the video mentioned above to see the data logger file and all of this in action.

Friday, June 19, 2015

How does your product react to a power line disturbance?

Power line disturbances can occur anywhere at any time. Your product can be exposed to disturbances such as voltage surges, sags, brownouts, cycle dropouts, or transients. If you are involved in the design, manufacture, or analysis of a power conversion product or circuit, you are interested in how your product reacts to power line disturbances because your product’s reaction will have a direct impact on how satisfied your customers are with the performance of your product. It is therefore critical for you to know how your product will react to power line disturbances. This knowledge comes only from direct measurement of the power line disturbance and the resultant behavior of your product.
Keysight’s IntegraVision power analyzer model PA2201A can allow you to gain quick insight into your product’s power consumption and dynamic behavior when it is exposed to power disturbances.
Next week, on Thursday, June 25, 2015, at 1:00 pm EDT, I will be presenting a live webinar on the topic “Successfully Make Power and AC Line Disturbance Measurements”. To get more information and to register to attend, please click this link: https://electronicdesign.com/webinar/successfully-make-power-and-ac-line-disturbance-measurements

If you are reading this BEFORE the webinar date, I hope you will attend the live presentation next week. If you are reading this AFTER the webinar date, the above link should bring you to a recording of the webinar.

Enjoy!

Thursday, February 26, 2015

When measurements and mathematics agree, I’m happy!

I have been an electrical engineer my entire career which will span 35 years in June (yikes….I’m too young to be this old!). Despite all of that time, plus the 4 years of undergraduate study before that and 3 years to get my MSEE at night while working full time during the day, I am still amused by some simple engineering principles. When the measurements I make in the real world completely agree with the hard-core theoretical mathematics I learned in school, I am amused.  Perhaps this should simply be expected (it is), but for some reason, I am still delighted when it happens. I recently had one of those simple experiences that I want to share with you today.

I was exploring some of the features on our new Keysight PA2201A IntegraVision power analyzer to better understand its operation and the applications for this new line of power measurement instrumentation. I had a simple desk lamp with a 100 W incandescent light bulb plugged into the wall outlet (120 Vac, 60 Hz here in the United States) and ran the voltage and current to the power analyzer. Given that the bulb presents a nearly pure resistive load to the sinusoidal voltage, as expected, the current was also a sine wave and in phase with the voltage. The power analyzer easily displays these measured waveforms.

What I never had an opportunity to see before was a visualization of the power waveform. For some reason, in all of my 35 years working in the power business, I never looked at a power waveform for a simple resistive load. Voltage? Sure! Current? Many times!! But power? Nope. The IntegraVision power analyzer shows voltage, current, and power waveforms as a typical display (this can be configured in quite a few other ways as well). So I was looking at the waveforms shown below.


The first thing I noticed about the power waveform was that it was sinusoidal and it never went below zero. This quickly made sense to me since I did consider the bulb to be purely resistive meaning it is consuming power 100% of the time, so all of the power flowing to the bulb had to be positive. The bulb is never pushing power back to the AC line as would happen with a reactive load especially for a purely reactive load such as a pure capacitor or inductor. If the load (the bulb) was not purely resistive, some of the power waveform would have dipped below the zero power line indicating that sometimes the load was absorbing power and sometimes it was providing power back to the line.

The next thing I noticed about the power waveform was that its phase was synchronized with the voltage and current, and it showed twice the frequency. Again, this quickly made sense since the power is simply the product of the voltage and the current [P(t) = V(t) * I(t)]. So the positive peaks have to line up (they do), the zero crossings of the voltage and current have to align with zero watts on the power waveform (they do), and the negative peaks in the voltage and current have to line up with another positive peak in the power since a negative voltage times a negative current yields a positive power (they do). This, of course, was the reason for the power waveform being twice the frequency of the voltage and current waveforms.

So I next decided to check the math behind the waveforms. I admit….I had to look up the trigonometric identity, but it was worth it! Since both the voltage and current waveforms are sine waves, and the power is the product of these, I looked up the identity for sine squared:
The voltage is a 120 Vrms, 60 Hz sine wave:
The current is 99.8 VA / Vrms = 0.832 Arms:
The power is V(t) * I(t):
Applying the above sine squared identity:
So you can see there is a 99.8 W fixed offset in the power waveform from which a cosine function is subtracted. The frequency of the cosine is 120 Hz (double the 60 Hz voltage and current waveforms). All of this completely agrees with the power waveform measured by the IntegraVision power analyzer. I am always thrilled when the math agrees with the measurements no matter how simple it is! How about you?

Thursday, January 29, 2015

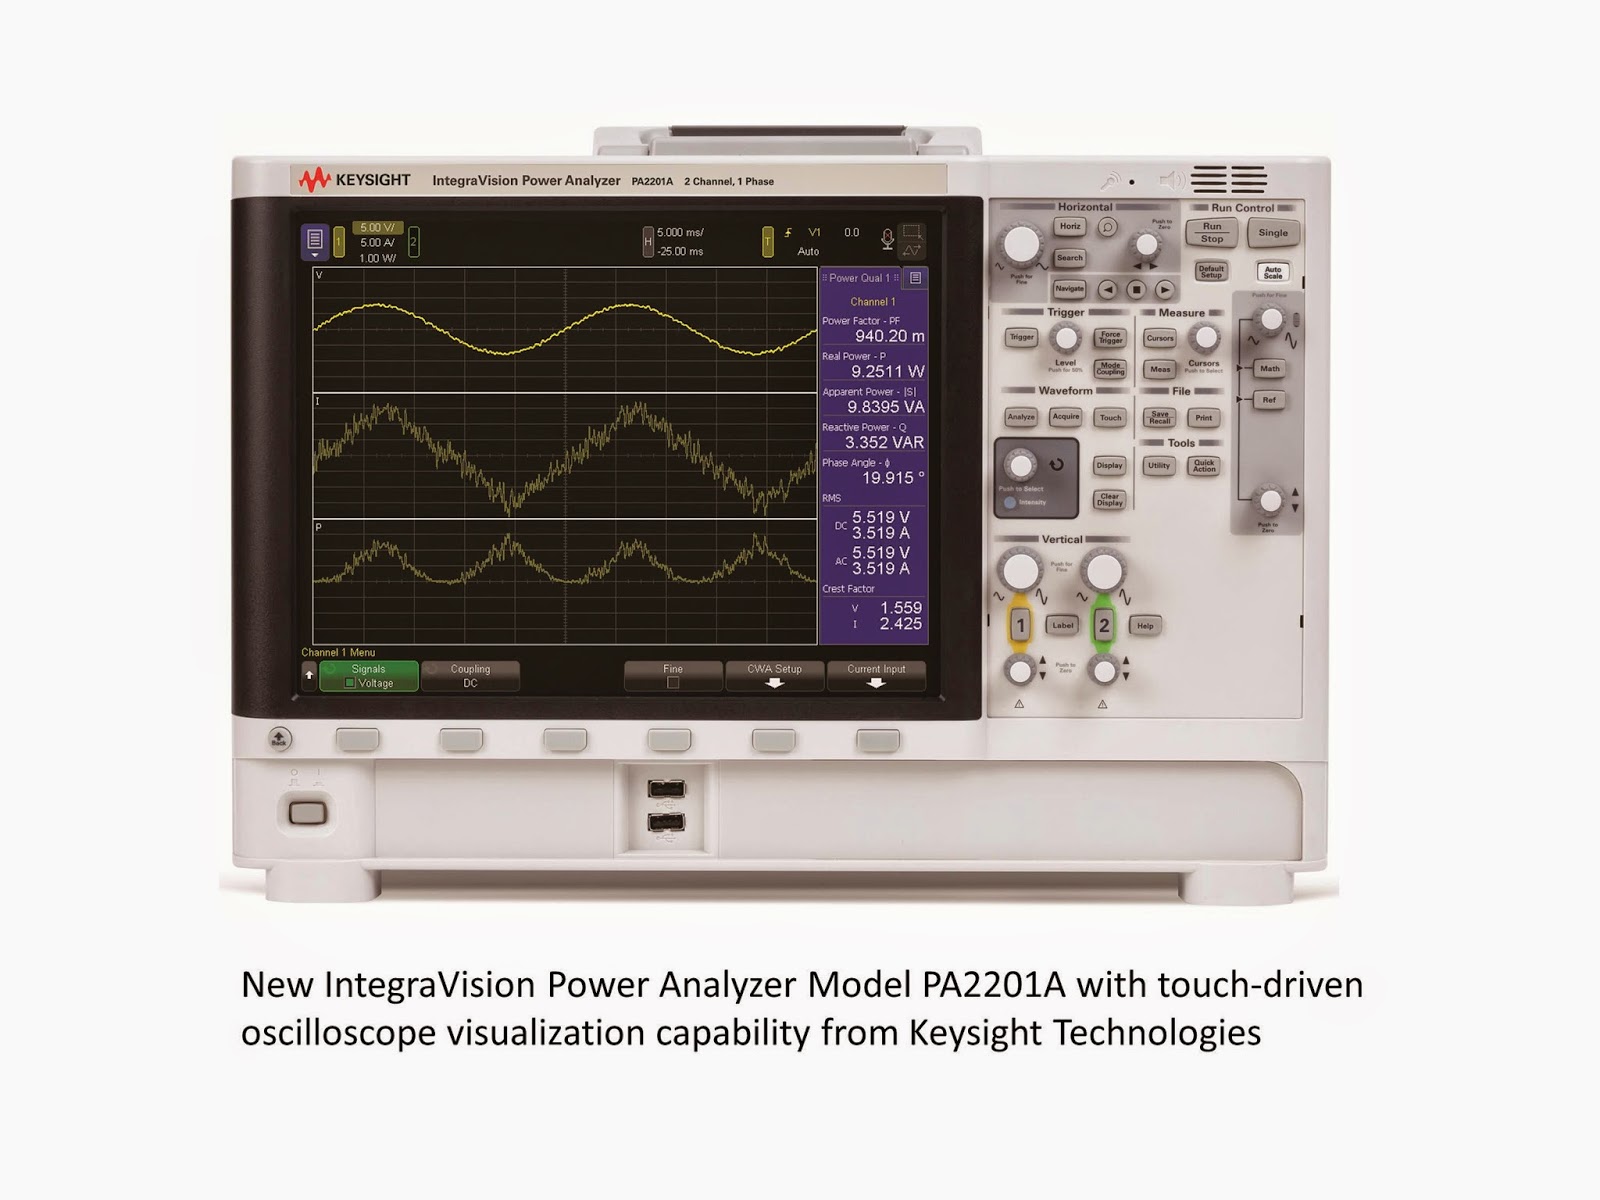
New Keysight Power Analyzer called IntegraVision

Back on June 23, 2014, I posted about the last Agilent power products to ever be announced. At that time, we had not yet officially changed our name from Agilent to Keysight. So the AC6800 AC sources we released on that date were released under the Agilent name, soon to be rebranded to Keysight. Well, today, I am announcing the first new Keysight power product: the Keysight Technologies IntegraVision Power Analyzer Model PA2201A.


A press release went out about these products earlier today: click here to view. We here at the Power & Energy Division of Keysight have been involved in power products for decades, and of course, Keysight has an oscilloscope division with commensurate experience producing scopes. I consider the new IntegraVision power analyzers to be a combination of the vast experience of our engineers from these two disciplines combining a power analyzer and an oscilloscope. The power analyzer will enable you to accurately measure parameters such as watts, VA, VAR, power factor, crest factor, efficiency, watt-hours, amp-hours, and harmonics while the oscilloscope will allow you to visualize in real time the voltage, current, and power waveforms that are important in your design.

I am very exciting about this new line of power measurement instruments! I have been working for HP/Agilent/Keysight for nearly 35 years now and have always worked with power products during my career. One of my favorite product families to support has been the older sophisticated 6800 AC Power Source/Analyzers (not to be confused with the newer basic AC6800 series mentioned in the first paragraph above). The older AC sources can produce sine waves, square waves, and arbitrary waveforms (for tests such as cycle dropout tests) as well as measure most of the power analyzer parameters mentioned above since they have a power analyzer built into the AC source. But now the new IntegraVision power analyzer goes well beyond the capabilities of the power measurements built into our AC sources. Adding time-based measurements like watt-hours and amp-hours opens up many more energy measurement application areas for this new product and the visual waveform measurements are a huge benefit when doing things like characterizing AC inrush current or product response to AC line disturbances. I am delighted with the performance of the touch-screen on this product – it will help you gain faster insight into your designs plus it just makes using the product fun! With 0.05% basic accuracy, 5 MSample/second 16-bit digitization, and inputs isolated to 1000 V, the IntegraVision power analyzer really is a superb product for power consumption and power conversion applications. Click here for the IntegraVision web page with links to the individual products.

So the next time you need a power analyzer with great accuracy and you also want to see the power waveforms related to your application, be sure to look at Keysight’s new IntegraVision Power Analyzer Model PA2201A. I’m sure you will not be disappointed! And look here for future posts about some of the interesting applications for this product, such as AC power line disturbance measurements and micro-inverter efficiency measurements. Suggest some of your own power measurements for me to make and I’ll see what I can do for a future post for you!