Showing posts with label programming. Show all posts

Thursday, July 30, 2015

How do I use Python (and no installed IO Library) to talk to my instrument?

Hello everybody,

Our newest support engineer and I have decided to learn Python (https://www.python.org/) so that we can generate programming examples.  We are hearing that more and more customers are using Python so we figured that we would get on the front side and learn some Python.  This blog represents my first attempts at doing anything in Python so there are probably better methods to do this but I wanted to get this out since I am pretty excited about it.  

What we are going to do is do use Python with Telnet and LAN to directly send SCPI commands to my instrument.  The major advantage of this is that with this method, you do not need to use an IO Library so you can use it in different operating systems.  Since we are going to be using Telnet with Python, the first thing that we are going to need to do is to make sure we understand how telnet works with our power supplies.  For all my work here, I will be using my N7953A Advanced Power System (APS) because it is on my desk and it is awesome.  The APS uses port 5024 for telnet.  On my PC running Windows 7, I enter the following in my command window:

Figure 1


Once I hit enter, I get our very friendly welcome screen:

Figure 2


Note the text “Welcome to …”, this will be important later.

To send commands or do queries, you just need to enter the SCPI command after the prompt.   The response to the query will automatically appear after you hit "Enter".  Here is how you do a *IDN? Query:

Figure 3


Note that the query response ends with a new line.  This will be important later.  The prompt also re-appears after every interaction.  In the case of the APS, the prompt is the model number ("N7953A>").  On some other instruments , the prompt is "SCPI>".  Either way, you need to know what the prompt is so that you can account for it later.

 Now that we are Telnet experts, we are going to switch to Python and send a *IDN? query to my APS.  The first thing we are going to do is to import the telnet library.  After that we are going to create our APS object by opening a telnet session to the instrument (sorry these screenshots might overflow the frame a very tiny bit):

Figure 4


Basically, we are at the same point we are at in Figure 1.  We essentially just hit the "Enter" key.  We need to get to the equivalent to Figure 2 so that we can send a command.  That means that we need to read out all of that welcome text from the power supply.  Luckily, the Python Telnet Library has a read_until function that will read text until it encounters a predefined string.  We know that our prompt to enter text in this case is "N6753A>" so that is what we are going to use:


Figure 5

Let’s send our *IDN? query.  You use the write command to write to the Telnet session.  Helpful tip: all commands sent through telnet need to be terminated with a newline ("\n"):

Figure 6

So now that we sent a query, we need to read the buffer to get the response.  Remember that the query response ends with a newline so we are going to use read_until and use the newline ("\n") as our read_until text:

Figure 7


As you can see we get the same response as before.

So now we sent our command and read the response, we need to read out the prompt again so that our power supply is ready to accept the next command sent to it.  We will just use the same read_until that we used before:
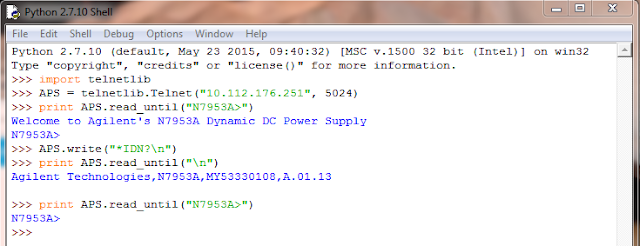
Figure 8


Now we are set to send the next command.

When you are done with programming the instrument, you end the Telnet session with the close command:

Figure 9


So that's an extremely basic example of how to use Python and Telnet.  I used the shell because that is what I used to figure this all out.  You can also write scripts.  As Chris and I learn more about Python, we will be releasing more examples.  Stay tuned for those.


Friday, May 29, 2015

Should I use RS-232 or GPIB to communicate with my instrument?

Hi everyone,

I am writing this as I am preparing to go to the beach for a week.  My topic today will be short but hopefully useful.    We are going to talk about a subject that has been near and dear to my heart for the past 15 years, serial versus GPIB communication on our instruments.

Back in the days before LAN and USB became instrument standard interfaces, many of our products were designed with RS-232 serial ports in addition to GPIB.  RS-232 is standard on the 681xB AC Source/Analyzers, the E36xxA bench power supplies, the N330xA Electronic loads, as well as a few other products.

RS-232 is an interesting option for communication because it is free, most people have them standard on their computers, and you really only need to buy a reasonably priced cable.  The main drawbacks are the fact that you need to put it in remote mode yourself using the "SYST:REM" command, that reasonably priced cable has to be properly configured, and it is slower than GPIB.  The main drawbacks of GPIB is that it costs more and you need to purchase hardware.

I did some benchmarking this morning using my trusty 6811B AC Source/Analyzer.  I used the proper RS-232 cable and my Keysight 82357B USB to GPIB converter to connect to the 6811B.  I wrote a small program that measures the time to send a "*IDN?" command and receive a response.  The program looped 100 times and calculated the average time.  With GPIB, the average time to send and read back took about 7 ms.  With RS-232, the same send command and read back the response took about 50 ms.

So to answer my titular question, "Should I use RS-232 or GPIB to communicate with my instrument?", my answer in every instance would be to use GPIB.  I know that it is more expensive but you really get what you pay for in this instance.  GPIB is a much faster, more reliable way to communicate with your instruments.

Thanks for reading.  Let us know if you have any questions.

Friday, January 30, 2015

Using the Passthrough Command in IVI drivers

Hi everybody!

I was working on a customer question yesterday and I thought that it would make an enlightening blog post.  We have a feature for our IVI-COM and IVI-C drivers that allows you to directly send SCPI commands to your instrument.  This is really useful if you run into a situation where you think there is a function is missing from our driver or you run into something unexpected.  Overall, it is pretty easy to use once you know where to find it.

Let's look at the IVI-COM driver first.  You can find the passthrough in the Systems Interface under the IO property.  One you get to the IO level, you can just use the standard VISA-COM commands to send commands to the instrument and read responses back.  For my little example here I am just going to send a voltage measurement and read back the response:

In the code above, agDrvr is the name I gave to the instrument when I initialized it.

We also provide an IVI-C driver.  The IVI-C driver also has a passthrough command that is just a little more complicated than the IVI-COM version.. To send SCPI commands, you use the AgN67xx_SystemWrite function and to read data back you would use the AgN67xx_SystemRead function.  The same example as above would look like this:

In this IVI-C code:
status is where the IVI-C driver will report an error if there is an unsuccessful call 
session is the handle that I gave to this instrument when I initialized
32 was my best guess at the size of the response string.  I like to overestimate.
strResp is where I want the response to be stored
respSize is the actual size of the response and is returned by the program

All in all it's not too difficult and will definitely come in handy.  

That all I have for you this month.  As always, let us know if you have any questions.

Matt


Friday, October 31, 2014

APS Paralleling Made Easier through Programming

Hi Everyone,

The Advanced Power Supply family has a very slick way to parallel units for higher current called current sharing.  This enables all of the paralleled units to be in Constant Voltage (CV) mode which is a change from most of our other power supplies that have one unit in CV mode and the rest of the units in Constant Current (CC) mode.  My colleague Ed did a very informative blog post about the different paralleling options that explains a bit more about paralleling units so I will not rehash any of that here.  Here is a link to that post: Paralleling Power Supplies.

The main drawback of the paralleling on the APS is that it can be a little difficult to get everything properly set to get the best performance.  You need to synchronize your current measurements and your voltage transients.  If you look in the manual, there are quite a few pages explaining how to set this all up.  I am happy to say that we have made this a little easier.  Our summer intern spent some time writing a VBA program in Excel that automatically does much of this.  The program uses Keysight VISA-COM so you need to have the Keysight IO Libraries installed to use it.  It will work with LAN, GPIB, and USB (all of which come standard on all APS units).

The first thing that we need to do is talk about the setup.  There are quite a few wire connections that need to be made.

First you need to connect the current sharing ports, the sense connections, and the outputs to the load:

After that, you also need to make some connections on the 8 pin  digital connector on the back of the APS units. You do not need to worry about setting up the pins if you plan on using the default pin assignments from the program.  The default pin assignments are:

Pin 6 on all units - On Couple
Pin 7 on all units - Off Couple
Pin 1 on the master unit - Trigger Out
Pin 1 on all other units - Trigger In
Pin 8 on all units - common

Here is a wiring diagram of the default assignments (for 3 units):


The On/Off Couple Pins make it so that when you enable or disable the output on any unit, all of the units enable or disable. The trigger line enable us to synchronize measurements as well as voltage changes.  

The Interface looks something like this:

It is divided into four boxes.  I will refer to them as boxes 1 to 4 with 1 being the left most box.  Box 1 is where you enter the VISA initialization string for each paralleled supply.  You can get this from the Keysight IO Libraries.  Box 2 is where you enter your settings  You can set the voltage limit, positive and negative current limit, change the output state, and change the voltage.  Most importantly, this is where you set the number of paralleled units.  This needs to be done or else the program will not work correctly.  You can parallel 1 kW and 2 kW units with each other, as long as they have the same maximum voltage so we also need to break out the number of 2 kW units in the scheme.  The third box will do a scalar measurement of the voltage and current.  This will report the total current of the paralleled units (it does a triggered measurement and adds all of the current measurements).  The fourth box will measure arrays of current and voltage (this function will not work on the N6900 APS units).      

I have posted this program on our Keysight Power Supply Forums at: Matt's Forum Post.  I have also opened a thread there where we can discuss this program.  It is still kind of preliminary so any feedback could possibly be incorporated into the program.  

That is all I have for this month.  Happy Halloween to all of our readers and please let me know any comments in the forum.


Sunday, August 31, 2014

How do I transfer files from my DC Power Analyzer to my PC?

Hi everybody!

I got back from my vacation just in time to get my August blog post out.  We typically try to shy away from product specific blog postings here at Watt's Up but this is a topic that I get a bunch of questions on in my support job and this is a great place for me to address it.

The Keysight N6705B DC Power Analyzer has an internal flash drive that stores information such as datalogs and scope waveforms.  When we first came out with the N6705B, it had a 64 MB drive (it is crazy how small that seems today).  Present N6705Bs have a 4 GB drive in them.  Since you can create datalogs of up to 2 GB in size, even a 4 GB drive can get full.  Today I am going to talk about how to get a file out of the internal drive of the N6705B and onto your PCs hard drive.

The way that I see it, there are three ways to get a file off the N6705B:

  1. The old fashioned way: You use a thumb drive and manually transfer the files that way.  The disadvantage here is that you need to have a thumb drive and there is no way to automate the process.
  2. You can use the N6705B LXI web interface.  There's a utility there that can transfer files bwtween the N6705B and your PC.  The disadvantages of this are that you cannot automate it and you can only do this if you are connected via LAN.
  3. There is a command (MMEM:DATA?) that will read back the contents of a file so you could write a SCPI program to do this.  This disadvantage here is that you need to write a program.  Luckily, I have done this in the past myself and I am more than willing to help!
Quite a few years ago, I wrote a VB 6 program that does number three.  The binary data for the file is in IEEE binary block format.  I find that the easiest way to read and write data in this format is to use Keysight VISA-COM and use the ReadIEEEblock function.  Here is a screen shot of my program listing:


As you can see in the program, I basically read the contents of the file default.dlog into filedata which I have dimensioned as  a byte array.  After I read all the data in, I kill any null data in the array and then copy it into a file that I have stored on my hard drive.  All in all, if you use this method it is pretty easy.

That's all I have for this month.  Please let me know if you have any questions or if you have discovered another way to transfer files.


Thursday, July 31, 2014

Using an IVI Class Compliant Driver

Hi everybody!

In the past, I have talked about the different driver options that we offer.  One of them is the IVI-COM/IVI-C driver.  IVI actually stands for Interchangeable Virtual Instruments. Today I am going to talk about how you can make that abbreviation true using the fact that our power supply can use the IviDCPwr class.   I have received  a few questions in the past about how to do this and every time I do it, it takes me a while to remember all of the steps.  Posting it here will put it somewhere where people (including me!) can find it easily

To start off you need to download and install the following:
  • The Agilent N6700 IVI-COM/IVI-C  driver from Agilent’s website.  If you get the driver from somewhere else, I am not sure how it will work.
  • NI VISA since you will need NI-MAX
  • IVI Compliance package

Once you have all of this, you are ready to get started.


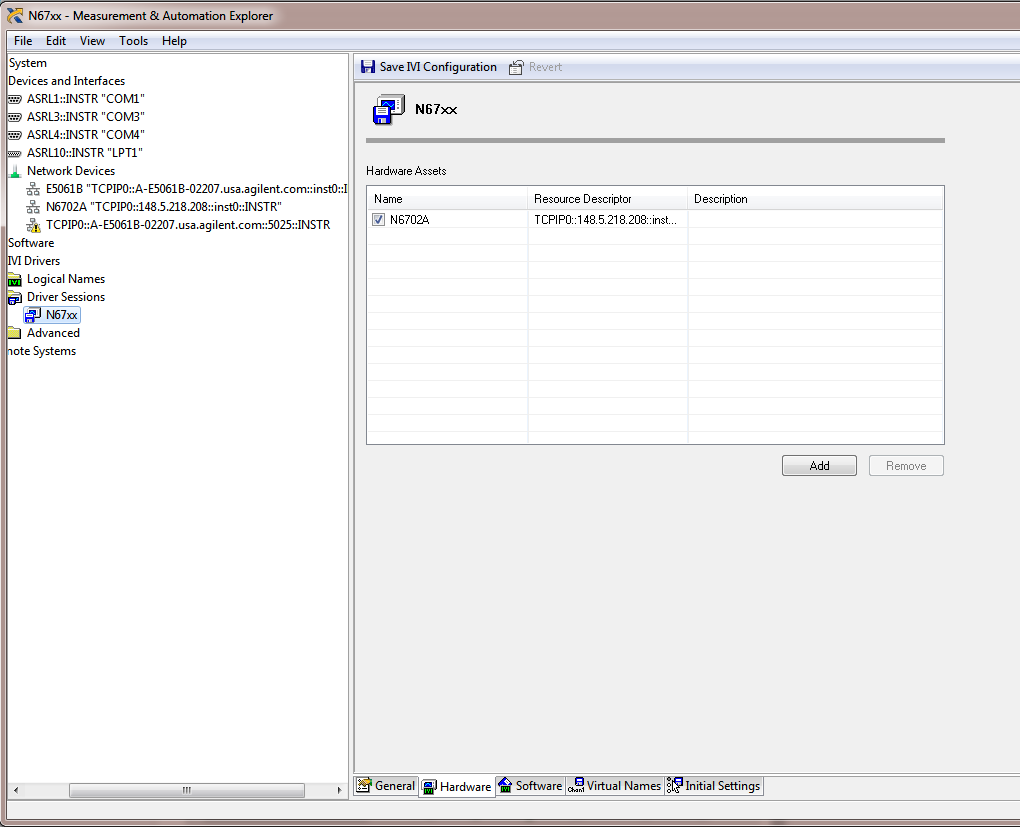
The first thing that you need to do is set your targeted instrument in NI-MAX.  I have a N6702A connected to my LAN.  Here's how it shows up in MAX:


After that, you want to go to the "IVI-Drivers" menu, select the "Driver Sessions" item and right click on it to select "Create new".   From there, click on the "software" tab and select the appropriate driver, in this case the AgN67xx driver.  


You can see here that the driver complies to the IviDcpwr class whcih is what we will be using.  

The next thing to do is in the "Hardware" Tab of the same menu.  You need to specify which instruments use this driver.  Click on "Add" to add your instrument.  It should look like this:


 One thing that I cannot stress enough is that you need to check that checkbox.  In you don't, this will not work and you will spend a little bit of time trying to figure out why you are getting resource not found errors.  Believe me I know this from experience!  After you double check everything make sure that you click on "Save IVI Configuration".

Now choose "Logical Names".  Right click on it and select "Create New".  I created a logical name called "MPS" (this stands for Modular Power System if you were wondering).  You need to refer it to the correct driver session:


Make sure to click on "Save IVI Configuration" again.

With that, you are ready to actually start!  I used Visual C++ 2010 to write my example.  Make sure that you have all of the IVI directories properly entered in your project.  Also make sure that you reference the ividcpwr.lib file in your "linker" settings. 

Here is my program listing:

#include <stdio.h>
#include "IviDCPwr.h"

void main()
{
ViStatus status;
ViSession session;
ViRsrc resource = "MPS";
ViConstString options  = "QueryInstrStatus=true, Simulate=false, DriverSetup= Model=, Trace=false";
ViBoolean idQuery = VI_FALSE;
ViBoolean reset   = VI_TRUE;
ViBoolean enabled = VI_TRUE;
ViChar ChannelName[16] = "";
        ViInt32 index = 2;
        ViInt32 bufferSize = 256;
ViConstString Cname;
ViReal64 Vmeasurement;
ViReal64 Ameasurement;

// This program initializes a session, programs a voltage and current on channel 2, 
// enables the output, and measures voltage and current.

status = IviDCPwr_InitWithOptions(resource, idQuery, reset, options, &session);
status = IviDCPwr_GetChannelName (session,index, bufferSize,ChannelName);

Cname = ChannelName;

status = IviDCPwr_ConfigureOutputEnabled (session,Cname,enabled);
status = IviDCPwr_ConfigureVoltageLevel (session,Cname,4.0);
status = IviDCPwr_ConfigureCurrentLimit(session, Cname, IVIDCPWR_VAL_CURRENT_TRIP, 1);

status = IviDCPwr_Measure (session,Cname,IVIDCPWR_VAL_MEASURE_VOLTAGE,&Vmeasurement);
printf("Measured Voltage on channel is : %f V \n",Vmeasurement);

status = IviDCPwr_Measure (session,Cname,IVIDCPWR_VAL_MEASURE_CURRENT,&Ameasurement);
printf("Measured Current on channel is : %f A \n",Ameasurement);

status = IviDCPwr_close (session);

printf("\n Done - Press Enter to Exit");
getchar();  
}

I am not going to go over the program in detail but here are the key things to note:
  • You need to include "IviDCPwr.h".  All the functions are in there.  You do not need to reference the instrument specific driver.
  • When you initialize the unit, you can refer to it by the name that you define in the "Logical Names" tab above.  In my case, I use "MPS".
  • This is a modular power supply.  The variable "index" is controlling the channel.  
  • I have tested this program and it works properly.
In theory, you should be able to swap this power supply out with another class compliant power supply with minimal programming changes (though in this case if you switch to a single output supply you would need to take out the references to the multiple channels).

One last thing that I want to note is that this will be the last Watt's Up blog posted under the Agilent banner.  Don't worry, we will still be posting the same great content but it will be under a Keysight Technologies banner.  I have been working for Agilent for 14 years now so it will be odd at first to have a new name but I am looking forward to posting many more blogs as a Keysight employee.  Goodbye Agilent Technologies it's been an interesting 14 years!


Monday, June 30, 2014

Doing Inrush Current Testing with the New AC6800 AC Sources

Hi everybody,

It is the last day of the month and therefore time for me to get my blog post out.  I want to build on Gary's latest post concerning the new Agilent/Keysight AC6800 AC Sources (Click Here).  One of the key features that Gary mentioned is inrush current testing.

My colleague Russ did a video on inrush current testing for the launch.  This gives you a little bit of perspective on why you want to do the testing and gives some good tips.


When you do inrush current testing, you typically want the highest value that the current has reached when the power is enabled.  The AC6800 has a peak hold current value that will store this value for you.  The unit stores the highest current value it has measured since that value was last cleared (either manually or from power on).  One key thing to remember is to always clear out the peak hold value before doing your measurement so that you know that your measurement is up to date.

The AC6800 can synchronize the enabling of the output to a user defined phase.  When you specify the phase, it will enable the output at that phase in the sine wave (anything from 0 to 360 degrees).  The combination of the peak hold measurement and this phase synchronization are what make this testing possible.  

I  did a video for the launch where I did a tour of the front panel, including a short description of how to do inrush current testing:


I also have a programming example on this topic.  Below is a snippet of a program that I wrote in VB.NET using Agilent VISA-COM:


That's about it for me this month.  Please let us know if you have any questions in the comments.  


Friday, May 30, 2014

Arbs! Arbs! Arbs!

Hi everybody,

We have a new intern here and we have recently been talking about the arbitrary waveform capabilities (from now on I will refer to this as arbs)  of our power supplies and I thought that this would make an interesting blog post.  This is a really cool feature that we offer in our products as it give you the ability to create an alternating signal using our DC power supplies.  The two types of arbs are the LIST system and the constant dwell arb.

The LIST arb is a feature that we have in quite a few of our products.  The N6700 family, the N7900 family, and even some of our older power supplies have this feature.  The "Arb" system in the N6705 DC Power Analyzer is similar to the LIST.  These LISTs can contain as many as 512 different points with a timing resolution as low as 1 us.  Each point consists of a voltage or current setting and a time.  The times can be different for each point.  A short example of a programmed LIST is:

VOLT:MODE LIST
LIST:VOLT 10,25,5
LIST:DWEL 5,1,4

In the example above, the voltage will start out at 10 V and stay for 5 seconds, then transition to 25 V for 1 s and then go to 5 V for 4 s.  As you can see there are 3 voltage values with 3 corresponding dwell times.

The second mode for arbs that is only available on the N6705B DC Power Analyzer and the N7900 APS is call the Constant Dwell Arb (CD Arb).  In this mode, you can program as many as 64K points but all of the defined points have the same dwell time.  If we want to do the same waveform as above, we need to choose what will be our dwell time.  Since the smallest dwell I used in my example is 1 s, I will choose that.  Here is what a small part of the code would look like:

VOLT:MODE ARB
ARB:VOLT:CDW:DWEL 1
ARB:VOLT:CDW 10,10,10,10,10,25,5,5,5,5

The code above will produce the same waveform as the LIST example.  CD Arbs can get pretty unwieldy when you have a ton of points but we do offer some tools in our 14585A Control and Analysis software that allow you to import and export csv files to make life a bit easier.

There are advantages and disadvantages to both.  As you can see, in some cases it is easier to program a list since it requires less dwell points and gives you more flexibility with what your dwell can be.  If your waveform has a lot of DC levels in it, then the standard list might work for you.  If you have a long, complex waveform the 64 Kpoints offered in an arb will most likely offer you the best option to replicate your waveform.

Whichever arb you pick, this is a very powerful tool.  I am thinking that I will follow this up at a future date with more information about arbs.  If you have any questions, feel free to leave us some comments.


Monday, March 31, 2014

Use the FETCH Command to Minimize Your Measurement Time

Hi everyone,

I am back again with another programming tip for you.  A neat feature on some of our products that many people many not know about is the ability to fetch measurements from a previous acquisition.  Quite a few of our power supplies and loads (the N6700 modules, the N7900 APS power supplies, the 681xB AC Sources, the N3300 loads, and probably some others that I am probably forgetting) have the ability to acquire voltage and current measurements at the same time.  This is done using the FETCH command (in my little example snippets I use the SCPI short form of FETC).  In a previous blog post I used this command to read back an array of current measurements (see Inrush Current Measurements).  In that command, I use a FETCH command to retrieve a triggered measurement.  

There is another, very useful way to use the FETCH commands.  I am not really sure what the best way to phrase it so I am going to take a shot and then illustrate with an example.  When you send a measure command (say for voltage), the measurement system will also acquire the other measurement (in this case current) and you can send a FETCH command to retrieve that acquired data.   Here is a very small example with some comments (all these commands tested on a N7952A Advanced Power System):

Example Snippet 1:
MEAS:VOLT? -> This will start a new acquisition and take the measurements 
<read back the voltage measurement data>
FETC:CURR? -> This will return the current measured during the voltage measurement above
<read back fetched current measurements>

Since we have voltage and current measurements, the instrument can calculate power:
FETC:POW? -> P=V*I
<read back calculated power>

Please note that you can do this with arrays as well. 

How can this save me time in my program you ask?  Well these power supplies all have built in digitizers that you can access with some programming commands.  The default measurement (at 60 Hz line frequency) is 3255 points measured at 5.12 us per point.  That is a total measurement time of  16.67 ms.  You have the ability to change this to fit your needs though.  You can measure up to 512 Kpoints at up to 40,000 s per point.  Every time you send a measure command you need to wait for the measurement to complete.  For instance:

Example Snippet 2:
MEAS:VOLT?
<read back the voltage measurement data> 
MEAS:CURR? 
<read back the current measurement data>

You will need to wait for two acquisition periods because you are initiating two separate measurements.  In the first example snippet, only the MEAS:VOLT? is initiating a measurement, the FETC:CURR is just reading data out of the instrument.    The downside is that the data that you fetch is going to be of the same age as the last measurement you did so if you need something newer, you need to do a new measurement.  Overall though I think that FETCH is a very useful command.  

I hope people find this useful.  Let us know if you have any questions by using the comments.  

Friday, January 31, 2014

More Information on the Awesomeness of binary data

Hi everybody!

This month I am going to do a build on one of Ed's posts from this month.  It was titled "Using Binary Data Transfers to Improve Your Test Throughput".  If you have not read it, go ahead and click on the link. I'll be here when you get back.

I wanted to reiterate how drastic the difference is between using these two interfaces when you are reading large amounts of data.   I did some bench-marking a little while ago and I wanted to share it now with everybody.  Please note that these were quick tests that I did and in no way are official numbers.  In fact if you see anything wrong with my methods, please comment.   

The first thing that I will talk about is my method.  I did the test with a N6700B MPS Mainframe and a N6781A SMU module.  I wrote a program that set up the module to source 5 V and then take an array of voltage measurements.  I set it for the maximum number of measurement points (524288 points) with the fastest sample rate (though for this experiment the sample rate does not really matter).  Before I did the reading of the data from the N6700B to my PC I started a programmatic stopwatch and stopped the stopwatch after the reading was complete.  I looped 20 times and took the average.

One thing that I would highly recommend is to use the Agilent VISA-COM IO library.  The VISA-COM library offers a ReadIEEEBlock function that makes reading binary data really easy for you.  

The screenshot below shows the relevant loop and the calculation.  This program was written in VB and I used LAN to communicate with the instrument.


The other important piece that this is not showing is that I am setting the data format to real using FORM REAL command.  When you use ASCII, the command is FORM ASCII (this is also the default setting).

You can see the commented out ReadString command that I swapped in when I used the ASCII data format.  You can also see my extremely professional (and useful) "I am on line" counter that I put in so that I knew my program was looping correctly.

So now for the times.  ASCII format took around 100 s to read back all 524288 measurements into a string.  When I switched to the binary format, it took under 5 seconds. As you can see, that is a very drastic difference and if you are reading back a lot of data from an instrument that supports the binary format, you really need to use it.

I also did a few other experiments.  I changed the total number of points down to 1000.  The binary format took a little under 20 ms to read the data and the ASCII format took about 125 ms.  The last test that I did was 3 data points.  The binary format took a little less than 15 ms and the ASCII format took under 5 ms to make the measurement.  So you can see that as you read less and less data back, the ASCII format does catch up to the binary format and even exceed it.

Moral of the story is that if it is something more than a few points to read back, use binary because it will save you a ton of time.

That's all I have this month and I will be back next month!


Wednesday, January 29, 2014

Using a DC Power Supply to Regulate Energy

In a previous 2-part posting I talked about what power and energy is (part 1 – energy) (part 2 – power).  It is pretty straight-forward thing to do to use a DC power supply for regulating voltage or current. Constant voltage (CV) and constant current (CC) regulation are standard features of most all DC power supplies used in testing. However, what if you have an unusual application calling for applying a fixed amount of energy to your device under test (DUT)? For example, adding a fixed amount of energy to a calorimeter or chemical process, or testing the must (or must not) tripping energy of a fuse, or circuit breaker, or squib or detonator perhaps?

When the resistance of a device remains constant, it is relatively straight-forward to apply a fixed amount of energy to a DUT. By applying a fixed voltage or current, the power in the DUT remains constant. Then the energy is simply:

E = (V2/R)*t = (I2*R)*t

Where E is the energy in watt-seconds or joules, V is voltage in volts, R is resistance in ohms, I is the current in amps, and t is time in seconds. All you now need to do is apply the constant voltage or current for a pre-determined amount of time and you will then be delivering a fixed amount of energy to your DUT.

Many times however, a lot of DUTs do not maintain constant loading. The may have a dynamically varying loading by nature or its resistance dramatically increases as it heats up. How do you regulate a fixed amount of energy to your DUT under these circumstances? One possibility is to use one of a few specialized power supplies on the market can regulate their outputs with constant power. As the DUT’s loading decreases or increases the power supply will adjust its output accordingly in order to maintain a constant output power delivered to the DUT.  Again then, by applying this constant power for a pre-determined amount of time you will then be delivering a fixed amount of energy to your DUT.

Still, for DUTs that do not maintain constant loading, it is very often not desirable, or outright unacceptable, to apply constant power sourcing.. It may be you can only apply a fixed voltage or current to your DUT. What can you do for these circumstances? Time can no longer remain a fixed value when trying to regulate a fixed amount of energy. The solution becomes quite a bit more complex, as depicted in Figure 1.


Figure 1: Regulating a fixed amount of energy to a DUT

Putting the solution depicted in Figure 1 into practice can prove challenging. The watt-hour meter needs to provide a trigger out signal when the desired watt-hour (or watt-second) threshold level is reached. This becomes even more challenging if this response time required needs to be just fractions of a second for this set up. More than likely this may become a piece of customized hardware.

Interestingly this very set up can be programmatically configured within our N6900A and N7900A series Advanced Power System (APS) power supplies. These products have Amp-hour and Watt-hour measurement integrated into their measurement systems. Not only can you measure these parameters, there is a programmable way to act on them in a variety of ways as well, which is the expression signal routing. Logical expressions can be programmed and downloaded into APS, which then acts on them at hardware-level speeds.  Creating and loading the signal routing expression into the APS unit is simplified by using the N7906A Power Assistance software, which let me do it graphically, as shown in Figure 2.


Figure 2: Graphically developing and loading an energy limit setting into an Agilent APS unit

In Figure 2 a threshold comparator was set to generate a trigger output at a level of 0.0047 watt-hours. This trigger was then routed to the output transient system, to cause the output to transition to a new output level when triggered. I had entered in zero volts as the triggered output level. Thus when the watt-hour reading reached its trigger point, the output went to zero, cutting off any more power and energy from being delivered to the DUT.

The SCPI command set for this signal routing expression is also generated from this software utility by clicking on “SCPI to clipboard”. This saves on the effort generating the code manually if you are incorporating the expression into a larger test program. For this expression the code generated is:

:SENSe:THReshold1:FUNCtion WHOur
:SENSe:THReshold1:WHOur 0.0047
:SENSe:THReshold1:OPERation GT
:SYSTem:SIGNal:DEFine EXPRession1,"Thr1"
:TRIGger:TRANsient:SOURce EXPRession1


To test things out a 1.18 ohm resistive load was used to draw 84.75 watts for a 10 volt output setting. The output cut back to zero volts at nearly 200 milliseconds, as expected. This is shown in the oscilloscope capture in Figure 3.


Figure 3: APS output for an 84.75 watt load and energy limit set to 0.0047 watt-hours

The load power was then doubled by increasing the output voltage to 14.142 volts. The APS output cut back to zero volts in half the time, delivering the same amount of energy, as expected. This is depicted in the oscilloscope capture in Figure 4.


Figure 4: APS output for a 169.5 watt load and energy limit set to 0.0047 watt-hours

While using a resistor makes it easy to see that a set amount of energy is being delivered to the load. However, being able to act on a real time watt-hour energy measurement makes it very practical to do deliver a fixed amount of energy, regardless of the dynamic nature of the load over time.

Tuesday, December 31, 2013

Using Agilent Command Expert to Help Write Programs

Happy New Year everyone!  

I am writing this on New Years Eve 2013 and I want to wish everyone a happy and safe 2014.  Ed, Gary, and I had a goal of getting 4 blog posts out a month this year and with this being the fourth blog post this month, we have met that goal!  Thank you to everyone for taking the time to read our blog.

Today, I am going to provide a short intro to  Agilent Command Expert (hereto referred to as ACE). ACE is a free tool that Agilent offers that helps you program your instruments. You can write simple scripts in ACE that you can save and share with other programmers.  The coolest feature of ACE is that it allows you to export the sequence to different programming languages.   You can find the latest version of Command Expert at: 


Using ACE is pretty easy.  The first thing that you need to do is set up your instrument.  My instrument is an Agilent N6700B.  Here is what the setup/edit screen looks like:  


Once you choose the instrument, ACE will download the command set so you do not need to have the programming guide handy.  This is a great feature since you can easily see all of the commands as well as all of the inputs and outputs of the commands. 

Here is the set voltage screen:


You can see here that it shows you all of the programmable items in the command (in this case the voltage and the channel list).  Once you set everything up as you'd want, click add step and it adds it to the sequence.

You can also do queries with ACE.  Here is how you would do a MEAS:VOLT? query:


Again, it shows you all of the programmable items (in this case only the channel list).  It also shows you that there is returned data.  Click add step to get it added to the sequence.

I am going to continue using the same SCPI command as I used in my example last week, here is completed sequence from the example from last month:


Now for the fun part!  You can export the sequence to just straight SCPI:


To C#:


To C++:


To VB.NET:


To Matlab:


It gives you the option to copy the text to the clipboard so that you can paste it into the text editor for your programming language.  

There is also a tool included that allows you to create sequences in Labview.  There is a really good tutorial included with the software that shows you how to do this.

There is a ton more info on the ACE webpage link at the beginning of this blog post.

I hope that this short intro to Agilent Command Expert was useful to everyone.  Please feel free to leave a comment.  Happy New Year everyone!


Friday, November 29, 2013

Using Labview without Using an Instrument Specific Driver

Hi everyone!

Labview is presently one of the most popular programming languages for programming test and measurement equipment.   Here at Power and Energy Central, we often get requests for more Labview programming examples for our products (which is definitely something on my agenda).   We also get requests for Labview drivers (which do exist for many of our products).  I thought that I would use this month’s blog posting to demonstrate how to program without using a driver.  There are a few advantages to this approach.  The first and main one is that it gives you access to the full SCPI command set of the instrument.  Anything you can do with the instrument is available to you.  The second advantage is that you do not need to worry about downloading and setting up drivers. 

I am going to work through an example using my Agilent N6700B on LAN.  We are going to use VISA calls in Labview to communicate with the instrument.  The first thing that we are going to need to do is get the VISA init string from the Agilent IO Libraries (or whatever IO Library you are using).  You can see the init string from my N6700B below (from the Agilent IO Libraries):


With the VISA address in hand, start up Labview and choose a blank VI.  Go to the Functions Pallette -> Instrument IO -> VISA ->Advanced and choose Open.  This function will open up a VISA session with your instrument.  There are quite a few inputs to this function but I usually just set up the instrument address and the VISA Open timeout:

After opening a session, we are ready to send our first commands.  I usually like to send a *RST and a *IDN?  so I know that I am in a known state and fully communicating with my instrument.   To send a command, you are going to go to the VISA menu and choose Write.  There are a few lines that you will need to connect here.  In Labview, you will always connect the “VISA Resource Name Out” and “error out” lines through your entire program (you will see that throughout this example).   The command is the other input.  This will need to be a string.  

Since we sent a query, we need to read out the output buffer.  This is done by choosing read in the VISA menu.   You need to do with the read are set the byte count to be read (I set it to 100 bytes so it is totally out of the way).   You also need a string indicator so that you can read and display the results of the *IDN query.


I am going to finish out my program by setting my supply to 4 V, turning the output on, and measuring the voltage.  All of these steps will use the same reads and writes that we used before.  The last thing I will do is use a VISA Close.  Using a Close will de-allocate all the resources and release the instrument.  This is generally good programming practice and is often overlooked.  Here is what the final program looks like:


After I run the completed program, I get the following results:


We can see that the results are as we expected and our program is working.

From this example, you can see that doing simple things is pretty easy in Labview.   If you are interested in downloading the example, please leave a comment here and I will post it so that you can get it.  As always, if you have any questions please feel free to post in our comments.  Take care!


Thursday, October 31, 2013

Power Supply Programming Part 2: What Type of Programming Language to Use

Happy Halloween Watt’s up fans!  Today I want to look at what programming language you are going to use to write your program.  Instead of recommending a particular language, I am going to break it down by graphical versus text based programming.

Let me start by saying that there really is no correct answer to this question.   This is a matter of personal taste.   

I am going to start with a bit about my background.  Unlike most of my colleagues, I did not specialize in analog electronics in college.  I focused more on computer engineering.  Due to this specialization, I have taken quite a few programming based courses.  I prefer sitting down and programming using a text based programming language because of my background. 

 Graphical programming languages are a very popular option (Agilent VEE is the one that I am most familiar with).     I find these programs are great for doing short programs.  If something can take up less than one page on your computer screen, then it works pretty well here.  These languages also make building user interfaces really easy since there are a lot of easy to access functions for controlling and displaying instrument data.  I personally find that they get very unwieldy if you want to send and read a lot of data with an instrument.  I also find the looping constructs to be strange.   People have told me that these graphical languages look very similar to circuit diagrams and I can see how people would prefer that kind of view to just plain text programming.

I am going to make a confession.  If I have to write a program quickly and I do not have to show it to anybody, I still will write it in HPBASIC.  I find it to be very easy to do simple instrument programming.  There is no need for drivers, once it is set up properly; sending and receiving information with an instrument is a breeze.    Large programs do not fare very well in HPBASIC though.

My preferred way to program these days is Visual Basic (using VISA-COM IO).  If you look at the power supply example programs that we provide, there is a lot of VB in there.  I feel that a text based program allows you to write much more compact code. It takes up a lot less screen space than an equivalent graphically based language.  Something like Visual Basic is also more versatile since it is not only for test and measurement but for more general applications.  The looping constructs work very nicely here and to me the flow makes more sense.  I also find typing quicker than connecting boxes.  Text based programming does have some cons though.  For one, the graphical languages are written from the bottom up to do instrument control.  They have built in functions and data manipulation that make thing easier.  The graphical languages also have some really good libraries for building User Interfaces. 

 The real correct answer to the questions is the best language to use is the one that you are most comfortable programming in.  If you think that I missed any pros or cons please feel free to share in the comments.