Friday, October 30, 2015

New data logger solves the mystery of inconsistent efficiency readings

(Today’s post was written by another one of our experienced engineers, Bill Griffith. Thanks, Bill, for sharing your knowledge and this new feature with everyone!)

While measuring the efficiency of a small 12 Vdc to 115 Vac power inverter the readings fluctuated between 87.80 % and 88.70 % with a consistent load. To learn more about the efficiency, an IntegraVision Power Analyzer with its new data logging feature was used to capture efficiency over time.

The new data logger feature captures every numerical measurement from each channel over a period of time. With just two parameters to configure, the data logger is easy to use. The length of data logging can be as short as 1 second or as long as 365 days. The interval for recording data can be set as low as 50 ms to as high as 24 hours. If an interval of 200 ms or longer is selected, THD and efficiency measurements are also saved. All measurements are gapless, continuous whole cycle measurements.

Below is a graph of efficiency. As you can see the efficiency changes over time.

Efficiency is calculated from the output power divided by the input power. The data logger file contains the output and input power. Both are graphed below.


We can see the efficiency is fluctuating due to the input power. The inverter contains a small fan that turns on about every 10 seconds and increases the amount of power required.

If you are interested in seeing a video of the inverter being tested, watch this YouTube video.

A couple of final notes on using the data logger: the data logger file is a csv file; the rows are time stamped and hold the measurements for each interval. Each column is for a different measurement and a single channel can have over 30 measurements. The columns are labeled for each type of measurement and by channel. Check out the video mentioned above to see the data logger file and all of this in action.

Wednesday, September 2, 2015

Yet another new Keysight power product family - this time, compact bench-top DC power!

Last week, I posted about our new photovoltaic (PV) array simulators, models N8937APV and N8957APV. These power supplies can produce an I-V curve as their output characteristic and provide up to 15 kW, 1500 V, and 30 A. Today, I am posting about yet another new series of Keysight power products (wow, our R&D team has been busy!). This new family is at the opposite end of the power spectrum compared to the 15 kW PV array simulators. The new family consists of five models in the 30 to 40 W range with voltages up to 100 V and currents up to 5 A all providing a standard rectangular output characteristic. Click here for the press release that just went out yesterday!

I really like this new family of power supplies and I think you will too!

Why?

Because….

You can choose from a variety of voltage and current combinations to meet your needs.

You can save space on your bench with these very compact models that are only 2U high and ¼-rack-width wide.

You can set and read back very accurate voltage and current values with a basic accuracy of 0.05%.

You can view the high visibility OLED display from nearly any angle.

You can regulate your set voltage at your load to make up for voltage drop in your load leads with remote sense terminals and leads.

You can communicate with these power supplies with either LAN or USB since both interfaces are included.

You can protect your device under test with the built in overvoltage protection and overcurrent protection.

And you can easily access all of the other beneficial features in this tiny package with the on-screen menu system.

So you can see that there is a lot you can do with these compact power packages!

Here is a listing of the models:
Below is a picture of the family showing each of the five new models.
So the next time you have to equip your bench with DC power that goes beyond a basic power supply, consider the new E36100 Series Programmable DC Power Supplies from Keysight Technologies. I know I would (but then again…..look where I work…..)!

Monday, August 31, 2015

What is meant by a “fast” power supply?

We regularly get requests for a power supply with a “fast” output. This means different things to different people, so we always have to ask clarifying questions. Not only do we need to find out what change needs to happen quickly, but we need to quantify the need and find out how quickly it needs to change. For example, recently, a customer testing power amplifiers wanted to know how quickly a particular power supply could attain its output voltage. Two ways to look at this are:

1. How long does it take for a power supply output voltage to change from one value to another value?
2. How long does it take for a power supply output voltage to recover to its original value following a load current change?

This customer wanted to know the answer to question 1. Luckily, both of these answers can be found in our specifications and supplemental characteristic tables.

Question 1 is referring to a supplemental characteristic that has a variety of similar names: programming speed, settling time, output response time, output response characteristic, and programming response time. This is typically described with rise time and fall time values, or settling time values, or occasionally with a time constant. Rise (and fall) time values are what you would expect: the time it takes for the output voltage to go from 10% of its final value to 90% of its final value. Settling time (labeled “Output response time” in the graph below) is the time from when the output voltage begins to change until it settles within a specified settling band around the final value, such as 1% or even 0.1%, or sometimes within an LSB (least significant bit) of the final value. My fellow blogger, Ed, posted about how this affects throughput (click here) back in September of 2013.

Question 2 is referring to a specification called transient response, or load transient recovery time. Whenever the load current changes from a low current to a higher current, the output voltage temporarily dips down slightly and then quickly recovers back to the original value (or close to it).
The feedback loop design inside the power supply determines how quickly the voltage recovers from this load current change. Higher bandwidth designs recover more quickly but are less stable. Likewise, lower bandwidth designs recover more slowly and are more stable. Ed posted about optimizing the output response back in April of this year (click here).

So the transient response recovery time is the time from when the load current begins to increase (coincident with the output voltage beginning to drop) to when the output voltage settles within a specified settling band around the final voltage value.

Our customer was interested in a “fast” power supply, meaning one with a settling time to meet his needs. Once we understood what he needed, we directed him to a power supply that could easily meet his requirements!


Forums and Programming Examples

Hi everybody!

I am not sure how many of you know but we have instrument specific forums at Keysight.  You can find the power supply forums at: Keysight Power Supply Forums.  If you have questions on power supplies you can post them there and either someone here will answer them or sometimes another user has had a similar experience.

We are also in the midst of revamping our example programs to make them more useful for our customers and would like feedback.  We are interested in the following pieces of information:

1. What programming languages/IO Libraries do you use? We are thinking of concentrating on VB.NET, C#, C/C++, Labview, Matlab, Excel (VBA), and Python. Are we missing anything? 

2. Any specific programming examples that would help you more effectively program your power supplies. I cannot guarantee that we will do them but anything requested will be considered. 


You can either answer these questions in the comments here or you could use the forums to respond to the thread that I just created for this blog post: Power Supply Programming Example Feedback Thread.

Thanks!


Friday, August 28, 2015

Verify inverter MPPT algorithms with Keysight’s new PV array simulators

While I normally avoid simply promoting new products in my blog posts, when Keysight Technologies announces a new power product, I feel obligated to mention it here. After all, this is Keysight’s power blog!

So, yesterday, Keysight Technologies announced two new photovoltaic array simulators. Click here for the press release.

The two new models are the N8937APV (208 Vac 3-phase input) and N8957APV (400 Vac 3-phase input). Both are autorangers and provide up to 15 kW, 1500 V, and 30 A on their outputs. Autoranging power supplies cover more output voltage and current combinations than power supplies with rectangular output characteristics. Click here for a previous post on autorangers and here for a post on the power supplies on which these two new models are based. These models can be put in parallel to provide a single output of up to 90 kW! They complement the family of Solar Array Simulators (SAS) that have been available from Keysight for decades.

Pictured below is the front panel of the two new photovoltaic array simulator models (15,000 W in a 3 U package):
So what is a photovoltaic array simulator? It is a specialized power supply that has an output characteristic that mimics the output characteristic of a solar panel (or a collection of solar panels known as a solar array). Photovoltaic (PV) simply refers to something that generates electricity when exposed to light so solar panels are PV devices. Solar panels have an output characteristic called an I-V curve that looks something like the solid line shown below. Isc is the short circuit current, Voc is the open circuit voltage, and Imp and Vmp are the current and voltage at the maximum power point.
Solar arrays are made by taking many solar panels and connecting them in series and parallel combinations for more power. When put in series, the total voltage increases. When put in parallel, the total current increases. Solar inverters take the DC output power from a solar array and convert it from DC into AC that can be used to power AC-mains devices (like those that plug in the wall in your home). So manufacturers of solar inverters are interested in testing their inverters and using a PV array simulator helps them. Instead of connecting their inverters to a real solar panel array that operates only when there is sunlight shining on it, they “simulate” the power output of the array with a PV array simulator. This enables them to test the inverter in many different conditions that affect the I-V curve of a solar panel, such as the temperature surrounding the panel, the angle of the sun on the panel, and cloud cover. Inverters must work when solar panels are subjected to all variations of these parameters, and waiting for them to occur with an actual solar array and the sun is not practical.

The inverter manufacturers are very interested in harvesting as much power as possible from the array, so they design their inverter circuitry to include Maximum Power Point Tracking (MPPT) algorithms that ensure their inverters operate at Pmax (the maximum power point) shown on the I-V curve above. The new Keysight photovoltaic array simulators allow engineers to test their MPPT algorithms.

So the next time you see a rooftop of solar panels, or a parking lot covered with them, or a field filled with panels collecting sunlight and converting it into electrical energy, think about the inverter connected to those panels converting the DC into AC for your use….hopefully, the inverter was fully tested with a Keysight SAS or one of these new photovoltaic array simulators!

Friday, August 14, 2015

Not all two-quadrant power supplies are the same when operating near or at zero volts!

Occasionally when working with customers on power supply applications that require sourcing and sinking current which can be addressed with the proper choice of a two-quadrant power supply, I am told “we need a four-quadrant power supply to do this!” I ask why and it is explained to me that they want to sink current down near or at zero volts and it requires 4-quadrant operation to work. The reasoning why is the case is illustrated in Figure 1.


 Figure 1: Power supply sinking current while regulating near or at zero volts at the DUT

As can be seen in the diagram, in practical applications when regulating a voltage at the DUT when sinking current, the voltage at the power supply’s output terminals will be lower than the voltage at the DUT, due to voltage drops in the wiring and connections. Often this means the power supply’s output voltage at its terminals will be negative in order to regulate the voltage at the DUT near or at zero volts.

Hence a four-quadrant power supply is required, right? Well, not necessarily. It all depends on the choice of the two-quadrant power supply as they’re not all the same! Some two-quadrant power supplies will regulate right down to zero volts even when sinking current, while others will not. This can be ascertained from reviewing their output characteristics.

Our N6781A, N6782A, N6785A and N6786A are examples of some of our two-quadrant power supplies that will regulate down to zero volts even when sinking current.  This is reflected in the graph of their output characteristics, shown in Figure 2.


Figure 2: Keysight N6781A, N6782A, N6785A and N6786A 2-quadrant output characteristics

What can be seen in Figure 2 is that these two-quadrant power supplies can source and sink their full output current rating, even along the horizontal zero volt axis of their V-I output characteristic plots. The reason why they are able to do this is because internally they do incorporate a negative voltage power rail that allows them to regulate at zero volts even when sinking current. While you cannot program a negative output voltage on them, making them two-quadrants instead of four, they are actually able to drive their output terminals negative by a small amount, if necessary. This will allow them to compensate for remote sense voltage drop in the wiring, in order to maintain zero volts at the DUT while sinking current. This also makes for a more complicated and more expensive design.

Our N6900A and N7900A series advanced power sources (APS) also have two-quadrant outputs. Their output characteristic is shown in Figure 3.


Figure 3: Keysight N6900A and N7900A series 2-quadrant output characteristics

Here, in comparison, a certain amount of minimum positive voltage is required when sinking current. It can be seen this minimum positive voltage is proportional to the amount of sink current as indicated by the sloping line that starts a small maximum voltage when at maximum sink current and tapers to zero volts at zero sink current.  Basically these series of 2-quadrant power supplies are not able to regulate down to zero volts when sinking current. The reason why is because they do not have an internal negative power voltage rail that is needed for regulating at zero volts when sinking current.


So when needing to source and sink current and power near or at zero volts do not immediately assume a 4-quadrant power supply is required. Depending on the design of a 2-quadrant power supply, it may meet the requirements, as not all 2-quadrant power supplies are the same! One way to tell is to look at its output characteristics.

Thursday, July 30, 2015

How do I use Python (and no installed IO Library) to talk to my instrument?

Hello everybody,

Our newest support engineer and I have decided to learn Python (https://www.python.org/) so that we can generate programming examples.  We are hearing that more and more customers are using Python so we figured that we would get on the front side and learn some Python.  This blog represents my first attempts at doing anything in Python so there are probably better methods to do this but I wanted to get this out since I am pretty excited about it.  

What we are going to do is do use Python with Telnet and LAN to directly send SCPI commands to my instrument.  The major advantage of this is that with this method, you do not need to use an IO Library so you can use it in different operating systems.  Since we are going to be using Telnet with Python, the first thing that we are going to need to do is to make sure we understand how telnet works with our power supplies.  For all my work here, I will be using my N7953A Advanced Power System (APS) because it is on my desk and it is awesome.  The APS uses port 5024 for telnet.  On my PC running Windows 7, I enter the following in my command window:

Figure 1


Once I hit enter, I get our very friendly welcome screen:

Figure 2


Note the text “Welcome to …”, this will be important later.

To send commands or do queries, you just need to enter the SCPI command after the prompt.   The response to the query will automatically appear after you hit "Enter".  Here is how you do a *IDN? Query:

Figure 3


Note that the query response ends with a new line.  This will be important later.  The prompt also re-appears after every interaction.  In the case of the APS, the prompt is the model number ("N7953A>").  On some other instruments , the prompt is "SCPI>".  Either way, you need to know what the prompt is so that you can account for it later.

 Now that we are Telnet experts, we are going to switch to Python and send a *IDN? query to my APS.  The first thing we are going to do is to import the telnet library.  After that we are going to create our APS object by opening a telnet session to the instrument (sorry these screenshots might overflow the frame a very tiny bit):

Figure 4


Basically, we are at the same point we are at in Figure 1.  We essentially just hit the "Enter" key.  We need to get to the equivalent to Figure 2 so that we can send a command.  That means that we need to read out all of that welcome text from the power supply.  Luckily, the Python Telnet Library has a read_until function that will read text until it encounters a predefined string.  We know that our prompt to enter text in this case is "N6753A>" so that is what we are going to use:


Figure 5

Let’s send our *IDN? query.  You use the write command to write to the Telnet session.  Helpful tip: all commands sent through telnet need to be terminated with a newline ("\n"):

Figure 6

So now that we sent a query, we need to read the buffer to get the response.  Remember that the query response ends with a newline so we are going to use read_until and use the newline ("\n") as our read_until text:

Figure 7


As you can see we get the same response as before.

So now we sent our command and read the response, we need to read out the prompt again so that our power supply is ready to accept the next command sent to it.  We will just use the same read_until that we used before:
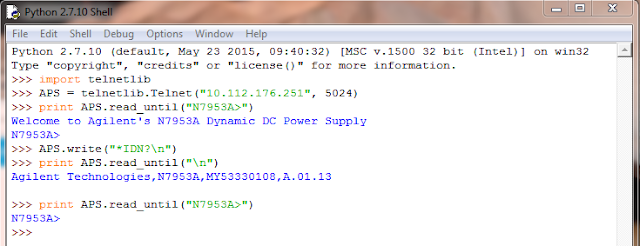
Figure 8


Now we are set to send the next command.

When you are done with programming the instrument, you end the Telnet session with the close command:

Figure 9


So that's an extremely basic example of how to use Python and Telnet.  I used the shell because that is what I used to figure this all out.  You can also write scripts.  As Chris and I learn more about Python, we will be releasing more examples.  Stay tuned for those.


Wednesday, July 29, 2015

Battery drain test on anniversary gift clock

Last month, on June 2, 2015, I celebrated working for Hewlett-Packard/Agilent Technologies/Keysight Technologies for 35 years. During the earlier times of my career, on significant anniversaries such as 10 years or 20 years, employees could choose from a catalog of gifts to have their contributions to the company recognized. That tradition has been discontinued, but I did select a couple of nice gifts over the years. During my HP days, one gift I selected was a clock with a stand shown here:
I have had that clock for decades and it uses a silver oxide button cell battery (number 371). I have to replace the battery about once per year and wondered if that made sense based on the battery capacity and the current drain the clock presents to the battery. I expected the battery to last longer so I wanted to know if I was purchasing inferior batteries. These 1.5 V batteries are rated for about 34 mA-hours. So I set out to measure the current drain using our N6705B DC Power Analyzer with an N6781A 2-Quadrant Source/Measure Unit for Battery Drain Analysis power module installed. Making the measurement was simple…..making the connections to the tiny, delicate battery connection points was the challenging part. After one or two failed attempts (I was being very careful because I did not want to damage the connections), I solicited the help of my colleague, Paul, who handily came up with a solution (thanks, Paul!). Here is the final setup and a close-up of the connections:


I set the N6781A voltage to 1.5 V and used the N6705B built-in data logger to capture current drawn by the clock for 5 minutes, sampling voltage and current about every 40 us. The clock has a second hand and as expected, the current showed pulses once per second when the second hand moved (see Figure 1). Each current pulse looks like the one shown in Figure 2. There was an underlying 200 nA being drawn in between second-hand movements. All of this data is captured and shown below in Figure 3 showing the full 5 minute datalog along with the amp-hour measurement (0.28 uA-hours) and average current measurement (3.430 uA) between the markers.


Given the average current draw, I can calculate how long I would expect a 34 mA-hour battery to last:

                 34 mAh / 3.430 uA average current = 9912.54 hours = about 1.13 years

This is consistent with me changing the battery about every year, so once again, all makes sense in the world of energy and electronics (whew)! Thanks to the capabilities of the N6705B DC Power Analyzer, I now know the batteries I’m purchasing are lasting the expected time given the current drawn by the clock. How much current is your product drawing from its battery?

Friday, July 24, 2015

“Adaptive Fast Charging” for faster charging of mobile devices

In some of my previous posts I have talked about USB power delivery 2.0 providing greater power so that mobile devices can be charged up more quickly with their USB adapters.  A key part of this is these devices are incorporating adaptive fast charging systems to accomplish faster charging. So how does this all work anyway?

Let’s first look at the way existing USB charging work, depicted in Figure 1.


Figure 1: Legacy standard USB charging system

When the mobile device is connected to the USB adapter, the mobile device first determines what kind of USB port it is connected to and how much charging current is available that it will be able to draw in order to recharge its battery. The mobile device then proceeds to internally connect its battery up to the USB power through an internal solid state switch that regulates the charging via the device’s internal battery management. However, a major limitation here is the amount of available current and power. Today’s mobile devices are using larger batteries. Up to 4 Ah batteries are commonly used in smart phones and over 9 Ah capacity batteries are being used in tablets. Even with later updates that increased the charging current to 1.5 amps for a dedicated charging port, this is a small fraction of the charging current and power these larger batteries can handle. As one example, a 9 Ah battery having a 1C recommended maximum charging rate equates to a 9 amp charging current. This requires overnight in order to significantly recharge the battery using standard USB charging.

The shortcomings of legacy USB for battery charging purposes has been well recognized and the USB Power Delivery 2.0 specification has been released to increase the amount of power available to as much as 100 watts. This is accomplished by greater voltage, up to 20 volts, and greater current, up to 5 amps. For a mobile device incorporating this, together with an adaptive fast charging system, is able to charge its battery in much less time. This set up is depicted in Figure 2.


Figure 2: USB adaptive fast charging system

With adaptive fast charging, when the mobile device is connected to the USB adapter, after determining that it has compatible fast charging capabilities, it then negotiates for higher voltage and power. After the negotiation the adapter then increases its output accordingly. A key thing here is the mobile device will typically incorporate DC/DC power conversion in its battery management system. Here it will efficiently convert the adapter’s higher voltage charging power into greater charging current at a voltage level comparable to the mobile device’s battery voltage, to achieve much faster charging. Now you will be able to recharge your device over lunch instead of overnight!


Wednesday, July 15, 2015

Optimizing the performance of the zero-burden battery run-down test setup

Two years ago I added a post here to “Watt’s Up?” titled:  “Zero-burden ammeter improves battery run-down and charge management testing of battery-powered devices” (click here to review). In this post I talk about how our N6781A 20V, 3A 20W SMU (and now our N6785A 20V, 8A, 80W as well) can be used in a zero-burden ammeter mode to provide accurate current measurement without introducing any voltage drop. Together with the independent DVM voltage measurement input they can be used to simultaneously log the voltage and current when performing a battery run-down test on a battery powered device. This is a very useful test to perform for gaining valuable insights on evaluating and optimizing battery life. This can also be used to evaluate the charging process as well, when using rechargeable batteries. The key thing is zero-burden current measurement is critical for obtaining accurate results as impedance and corresponding voltage drop when using a current shunt influences test results. For reference the N678xA SMUs are used in either the N6705B DC Power Analyzer mainframe or N6700 series Modular Power System mainframe.
There are a few considerations for getting optimum performance when using the N678xA SMU’s in zero-burden current measurement mode. The primary one is the way the wiring is set up between the DUT, its battery, and the N678xA SMU. In Figure 1 below I rearranged the diagram depicting the setup in my original blog posting to better illustrate the actual physical setup for optimum performance.

Figure 1: Battery run-down setup for optimum performance
Note that this makes things practical from the perspective that the DUT and its battery do not have to be located right at the N678xA SMU.  However it is important that the DUT and battery need to be kept close together in order to minimize wiring length and associated impedance between them. Not only does the wiring contribute resistance, but its inductance can prevent operating the N678xA at a higher bandwidth setting for improved transient voltage response. The reason for this is illustrated in Figure 2.


Figure 2: Load impedance seen across N678xA SMU output for battery run-down setup
The load impedance the N678xA SMU sees across its output is the summation of the series connection of the DUT’s battery input port (primarily capacitive), the battery (series resistance and capacitance), and the jumper wire between the DUT and battery (inductive). The N678xA SMUs have multiple bandwidth compensation modes. They can be operated in their default low bandwidth mode, which provides stable operation for most any load impedance condition. However to get the most optimum voltage transient response it is better to operate N678xA SMUs in one of its higher bandwidth settings. In order to operate in one of the higher bandwidth settings, the N678xA SMUs need to see primarily capacitive loading across its remote sense point for fast and stable operation. This means the jumper wire between the DUT and battery must be kept short to minimize its inductance. Often this is all that is needed. If this is not enough then adding a small capacitor of around 10 microfarads, across the remote sense point, will provide sufficient capacitive loading for fast and stable operation. Additional things that should be done include:
  • Place remote sense connections as close to the DUT and battery as practical
  • Use twisted pair wiring; one pair for the force leads and a second pair for the remote sense leads, for the connections from the N678xA SMU to the DUT and its battery


By following these best practices you will get the optimum performance from your battery run-down test setup!

Tuesday, June 30, 2015

Using User Defined Statuses on the APS

Hi Everyone,

I wanted to talk about a feature in our Advanced Power Supply family (APS from here on out)  that not too many people know about.  The APS features two user defined statuses in the Operation Status group.  Here is a rundown of all the entries in the group:


You can see that bits 7 and 8 are User1 and User2.

Using the advanced triggering system for the APS you can define what conditions will trigger a change in these two statuses.  The N7906A Power Assistant Software (download link) has a very handy graphical way to set up the trigger.   As an example, let's say that I wanted to change the user defined status when the voltage exceeds 1 V and the unit goes into positive current limit status.  Using the Power Assistant Software I would whip up the following:


After I draw out my trigger expression, I can either download it to my APS or I can click the "SCPI to Clipboard" button on the top of the page.  If I hit that button now and then hit paste here, I get:

:SENSe:THReshold1:FUNCtion VOLTage
:SENSe:THReshold1:VOLTage 1
:SENSe:THReshold1:OPERation GT
:SYSTem:SIGNal:DEFine EXPRession1,"Thr1 AND CL+"
:STATus:OPERation:USER1:SOURce EXPRession1

I can just copy this code into my program.  It's a pretty convenient.

I think the big question is: What can you do with this?  The answer is: whatever you want.  It's user defined so you can use it in whatever way you see fit.  If you want to check if the current exceeds a certain threshold you don't want to do a bunch of measure commands in loop, you can define that as your trigger and then just check the Operation Status Group (using the STAT:OPER? or STAT:OPER:COND? queries). 

I think that the most powerful thing that you can do with this is set up a SRQ handler to act when the user statuses change.  This is actually a project that I am working on presently so I have not implemented this just yet (but I will in the near future).   When I do, I will definitely write a blog post about it though!  I wanted to get the word out about this because even I did not automatically think about this when faced with a issue that just screamed to use this.  

Thanks for reading and stay tuned for a future installment on this topic! 


Friday, June 19, 2015

How does your product react to a power line disturbance?

Power line disturbances can occur anywhere at any time. Your product can be exposed to disturbances such as voltage surges, sags, brownouts, cycle dropouts, or transients. If you are involved in the design, manufacture, or analysis of a power conversion product or circuit, you are interested in how your product reacts to power line disturbances because your product’s reaction will have a direct impact on how satisfied your customers are with the performance of your product. It is therefore critical for you to know how your product will react to power line disturbances. This knowledge comes only from direct measurement of the power line disturbance and the resultant behavior of your product.
Keysight’s IntegraVision power analyzer model PA2201A can allow you to gain quick insight into your product’s power consumption and dynamic behavior when it is exposed to power disturbances.
Next week, on Thursday, June 25, 2015, at 1:00 pm EDT, I will be presenting a live webinar on the topic “Successfully Make Power and AC Line Disturbance Measurements”. To get more information and to register to attend, please click this link: https://electronicdesign.com/webinar/successfully-make-power-and-ac-line-disturbance-measurements

If you are reading this BEFORE the webinar date, I hope you will attend the live presentation next week. If you are reading this AFTER the webinar date, the above link should bring you to a recording of the webinar.

Enjoy!

Tuesday, June 16, 2015

When is it best to use a battery or a power supply for testing my battery powered device?

As I do quite a bit of work with mobile battery powered devices I regularly post articles here on our “Watt’s Up?” blog about aspects on testing and optimizing battery life for these devices. As a matter of fact my posting from two weeks ago is about the webcast I will be doing this Thursday, June 18th: “Optimizing Battery Run and Charge Times of Today’s Mobile Wireless Devices”. That’s just two days away now!

With battery powered devices there are times it makes sense to use the device’s actual battery when performing testing and evaluation work to validate and gain insights on optimizing performance. In particular you will use the battery when performing a battery run-down test, to validate run-time. Providing you have a suitable test setup you can learn quite a few useful things beyond run-time that will give insights on how to better optimize your device’s performance and run-time. I go into a number of details about this in a previous posting of mine: “Zero-burden ammeter improves battery run-down and charge management testing of battery-powered devices”. If you are performing this kind of work you should find this posting useful.

However, there are other times when it makes sense to use a power supply in place of the device’s battery, to power up the device for the purpose of performing additional types of testing and evaluation work for optimizing the device’s performance. One major factor for this is the power supply can be directly set to specific levels which remain fixed for the desired duration. It eliminates the variability and difficulties of trying to do likewise with a battery, if at all possible. In most all instances it is important that the power supply provides the correct characteristics to properly emulate the battery. This includes:
  • Full two-quadrant operation for sourcing and sinking current and power
  • Programmable series resistance to simulate the battery’s ESR

These characteristics are depicted in the V-I graph in figure 1.


Figure 1: Battery emulator power supply output characteristics

Note that quadrant 1 operation is emulating when the battery is providing power to the device while quadrant 2 is emulating when the battery is being charge by the device.


A colleague here very recently had an article published that goes into a number of excellent reasons why and when it is advantageous to use a power supply in place of trying to use the actual battery, “Simulating a Battery with a Power Supply Reaps Benefits”. I believe you will find this to also be a useful reference.

Wednesday, June 3, 2015

Webcast this June 18th: Optimizing Battery Run and Charge Times of Today’s Mobile Wireless Devices

One thing for certain: Technological progress does not stand still for a moment and there is no place where this is any truer than for mobile wireless devices! Smart phones, tablets, and phablets have all but totally replaced yesterday’s mobile phones and other personal portable devices. They provide virtually unlimited information, connectivity, assistance, and all kinds of other capabilities anywhere and at any time.

However, as a consequence of all these greater capabilities and time spent being actively used is battery run time limitations. Battery run time is one of top dissatifiers of mobile device users. To help offset this manufacturers are incorporating considerably larger capacity batteries to get users through their day. I touched upon this several weeks ago with my earlier posting “Two New Keysight Source Measure Units (SMUs) for Battery Powered Device and Functional Test”. We developed higher power versions of our N678xA series SMUs in support of testing and development of these higher power mobile devices.

Ironically, a consequence of higher capacity batteries leads to worsening of another top user dissatifier, and that is battery charging time. Again, technological progress does not stand still! New specifications define higher power delivery over USB, which can be used to charge these mobile devices in less time. I also touched upon this just a few weeks ago with my posting “Updates to USB provide higher power and faster charging”. The power available over USB will no longer be the limiting factor on how long it takes to recharge a mobile device.

I have been doing a good amount of investigative work on these fronts which has lead me to put together a webcast “Optimizing Battery Run and Charge Times of Today’s Mobile Wireless Devices”. Here I will go into details about operation of these mobile devices during use and charging, and subsequent testing to validate and optimize their performance.  If you do development work on mobile devices, or even have a high level of curiosity, you may want to attend my webinar on June 18. Additional details about the webcast and registration are available at: “Click here for accessing webcast registration”. I hope you can make it!


Friday, May 29, 2015

How to calculate the accuracy of a power measurement

Electrical power in watts is never directly measured by any instrument; it is always calculated based on voltage and current measurements. The simplest example of this is with DC (unchanging) voltage and current: power in watts is simply the product of the DC voltage and DC current:
So the accuracy of the power measurement (which is calculated from the individual voltage and current measurements) is dependent on the accuracy of the individual V and I measurements.

For example, you might use a multimeter to make V and I measurements and calculate power. The accuracy of these individual measurements is typically specified as a percent of the reading plus a percent of the range which is an offset. (Note that “accuracy” here really means “inaccuracy” since we are calculating the error associated with the measurement.)

Let’s use an example of measuring 20 Vdc and 0.5 Adc from which we calculate the power to be 10 W. We want to know the error associated with this 10 W measurement. Looking up the specs for a typical multimeter (for example, the popular Keysight 34401A), we find the following 1-year specifications:

DC voltage accuracy (100 V range): 0.0045 % of reading + 0.0006 % of range
DC current accuracy (1 A range): 0.1 % of reading + 0.01% of range

The error (±) associated with the voltage measurement (20 V) is:
So when the measurement reading is 20.0000 V, the actual voltage could be any value between 19.9985 V and 20.0015 V since there is a 1.5 mV error associated with this reading.

The error (±) associated with the current measurement (0.5 A) is:
So when the measurement reading is 0.5 A, the actual current could be any value between 0.4994 A and 0.5006 A since there is a 0.6 mA error associated with this reading.

We can now do a worst-case calculation of the error associated with the calculated power measurement which is the product of the voltage and current. The lowest possible power value is the product of the lowest V and I values: 19.9985 V x 0.4994 A = 9.98725 W. The highest possible power value is product of the highest V and I values: 20.0015 V x 0.5006 A = 10.01275 W. So the error (±) associated with the 10 W power measurement is ± 12.75 mW.

The above is the brute-force method to determine the worst-case values. It can be shown that the percent of reading part of the power measurement error can be very closely approximated by the sum of the percent of reading errors for the V and I. Likewise, it can be shown that the offset part of the power measurement error can be very closely approximated by the sum of the voltage reading times the current offset error and the current reading times the voltage offset error:
Applying this equation to the example above for the 100 V and 1 A ranges at 20 V, 0.5 A:
So for 10 W, we get:
As you can see, this is the same result as produced by the brute-force approach. Isn’t it great when math works out the way you expect?!?!

In summary, the error associated with a power measurement calculated as the product of a voltage and current measurement has two parts just like the V and I errors: a % of reading part and an offset part. The % of reading part is closely approximated by adding the % of reading parts for the V and I measurements. The offset part is closely approximated by adding two products together: the voltage reading times the current offset error and the current reading times the voltage offset error. It’s as simple as that!

Should I use RS-232 or GPIB to communicate with my instrument?

Hi everyone,

I am writing this as I am preparing to go to the beach for a week.  My topic today will be short but hopefully useful.    We are going to talk about a subject that has been near and dear to my heart for the past 15 years, serial versus GPIB communication on our instruments.

Back in the days before LAN and USB became instrument standard interfaces, many of our products were designed with RS-232 serial ports in addition to GPIB.  RS-232 is standard on the 681xB AC Source/Analyzers, the E36xxA bench power supplies, the N330xA Electronic loads, as well as a few other products.

RS-232 is an interesting option for communication because it is free, most people have them standard on their computers, and you really only need to buy a reasonably priced cable.  The main drawbacks are the fact that you need to put it in remote mode yourself using the "SYST:REM" command, that reasonably priced cable has to be properly configured, and it is slower than GPIB.  The main drawbacks of GPIB is that it costs more and you need to purchase hardware.

I did some benchmarking this morning using my trusty 6811B AC Source/Analyzer.  I used the proper RS-232 cable and my Keysight 82357B USB to GPIB converter to connect to the 6811B.  I wrote a small program that measures the time to send a "*IDN?" command and receive a response.  The program looped 100 times and calculated the average time.  With GPIB, the average time to send and read back took about 7 ms.  With RS-232, the same send command and read back the response took about 50 ms.

So to answer my titular question, "Should I use RS-232 or GPIB to communicate with my instrument?", my answer in every instance would be to use GPIB.  I know that it is more expensive but you really get what you pay for in this instance.  GPIB is a much faster, more reliable way to communicate with your instruments.

Thanks for reading.  Let us know if you have any questions.

Friday, May 22, 2015

New performance options for the N6900A Advance Power System gives greater versatility for your test needs

Our N6900 and N7900 series Advanced Power System (APS) DC power supplies are some of our most sophisticated products, setting new levels of performance and capabilities on many fronts. They come in 1kW and 2kW power levels as shown in Figure 1 and can be grouped together to provide much greater power levels as needed.


Figure 1: N6900 and N7900 Advanced Power System 1kW and 2kW models

Most noteworthy is that these can be turned into full two-quadrant DC sources by connecting up the optional 1kW N7909A Power Dissipator (2 needed for 2kW units) providing 100% power sinking capability. This makes APS an excellent solution for battery, battery management and many alternative energy applications, where both sourcing and sinking power are needed.
  • The N6900 series DC power supplies are designed for ATE applications where high test throughput and high performance is critical.
  • The N7900 series dynamic DC power supplies are designed for ATE applications where high speed dynamic sourcing and measurement is needed, in additions to high performance.

A lot more about these products is covered in another post on our General Purpose Electronic Test Equipment (GEPTE) blog when they were first announced. This is a great resource for learning more about APS and can be accessed from the following link: “New Advanced Power System: Designed to Overcome Your Toughest Test Challenges”

If you are a regular visitor to the “Watt’s Up?” blog no doubt you have seen we have shared a lot about how to do things with the N6900 series and N7900 series APS to address a number of difficult test challenges. A lot of times it would have otherwise required additional equipment or custom hardware to accomplish these tasks. While many of these examples are suitable for the N6900 and N7900, a good number of times examples make use of the additional capabilities only available in the N7900 series.

In certain test situations the N6900 series APS would be a great solution and lower cost than the N7900 series, if only it also had a certain additional capability. To this end Keysight has recently announced four new performance options for the N6900 series APS to address a specific test need you may have, as follows:
  1. Accuracy Package (option 301): Adds a second seamless measurement range for current
  2. Measurement Enhancements (Option 302): Adds external data logging and voltage and current digitizers with programmable sample rates
  3. Source and Speed Enhancements (Option 303): Adds constant dwell arbitrary waveforms and output list capability, and faster up and down programming speed
  4. Disconnect and Polarity-Reversal Relays (Option 760 and 761): Provides galvanic isolation and allows output voltage to be switched between positive and negative values

 Additional details about the N6900 series APS and the four new performance options are available from the recent press release, available at the following link: “Keysight Technologies adds Versatile Performance Options to Industry’s Fastest Power Supplies”

With these new options you now have a spectrum of choices in the Advanced Power System product family to better address any test challenges you may be faced with!

Wednesday, May 20, 2015

Updates to USB provide higher power and faster charging

For those who regularly visit our blog here are already aware I do a fair amount of work with regard to test methodologies for optimizing battery life on mobile wireless devices. One directly related topic I have been actively investigating these past few months is the battery charging aspects for these devices. Recharging the battery on these devices takes a considerable amount of time; typically a couple of hours or longer, and it’s only been getting worse. However, there has been a lot of work, activity, and even new product developments that are making dramatic improvements in recharging your devices’ batteries in less time!

The USB port has become the universal connection for providing charging power for mobile devices. When initially available a USB port could provide up to 500 mA for general power for peripheral devices. It was recognized that this was also a convenient source for charging portable devices but that more current was needed. The USB BC (battery charging) standard was established which formalized charging initially for up to 1.5 amps at 5 volts.

This higher charging current and power was alright for mobile devices of a couple of generations ago, but today’s smart phones, tablets, and phablets are using much larger and higher capacity batteries. The end result is, because USB is 5 volts its power thus limited to 7.5W, that it can take several hours to recharge a device’s battery.  This can be very inconvenient if your battery goes dead during the day!

Simply increasing the USB current is not a total answer as this has limitations. First, the micro USB connectors on mobile devices are rated for no more than about 1.8 to 2 amps. To help on this front there is the new USB Type-C cable and connector specification released last year. The new type-C micro connectors are able to handle up to 3 amps and the standard connectors able to handle up to 5 amps. Higher current alone is not quite enough. Also issued last year was the new USB Power Delivery 2.0 specification. This specifies a system capable of providing up to 20 volts and 5 amps. This is more than order of magnitude improvement in power over the existing USB power. Long charging times due to power limitations will become a thing of the past.

The new USB power delivery voltages and currents are a discrete set of levels as shown in table 1. As can be seen the levels depend on the profile/port designation.


Table 1: USB power delivery 2.0 voltage and current levels

The cables and connectors of course need to be able to handle the given level of current and power.  In review of the standard a lot of work and effort has gone into providing this new capability while maintaining compatibility with the past as well. Thus for a new mobile device to take advantage of these higher power levels, it must be capable of negotiating with the charging power port to furnish it. At the same time, if an earlier generation mobile device is connected, it will only be able to get the default USB 5 volt level.


I’m looking forward to seeing this new USB power delivery put into wide-spread use in various innovative new products. Expect to see more about this topic in future posts from me here!

Thursday, April 30, 2015

When is a number not a number?

All of our power supplies measure their own output voltage and output current. These measured values are available to you from the front panel and over the bus. They may be displayed as an average value or a digitized waveform. Some products have different measurement ranges you can set that affect the accuracy of the measurement and the noise floor of the measurement. Of course, there is a maximum value that each measurement range is capable of measuring. So what happens to the reading if the actual output voltage or current exceeds the maximum value of the measurement range? What does the front panel show and what value do you get if you read it back over the bus?

Below is an example where I set the current measurement range to the 1 mA range on a Keysight N6781A Source/Measure Unit. I then forced more than 1 mA to flow out of the output. As you can see, the front panel indicates “Overload”. If you perform a current measurement and read the result back to your PC, you will get 9.91E37. This is a value defined in the SCPI (Standard Commands for Programmable Instruments) standard to mean “not a number” (NAN). Since Keysight products follow the SCPI standard, we return this number when a range is overloaded. This numeric value for NAN was chosen so that it can be represented as a 32-bit floating point number and is larger than anything expected to occur while using instrumentation. In addition to an overload condition on an instrument, NAN can also be used as the result when, for example, you divide zero by zero or subtract infinity from infinity.
This predefined number is also used when waveform data exceeds the maximum rating of a particular range. The screenshot below on the left shows data that does not overload the range. But when the range is changed and part of the waveform exceeds the maximum rating of the range, that part of the waveform data shows up on the screen in red and when returned to a PC, the value is the NAN value of 9.91E37.

Two other unique numbers defined by the SCPI standard are used to represent positive infinity and negative infinity. For positive infinity (INF), 9.9E37 is used. For negative infinity (NINF), -9.9E37 is used. These values can be used to mean “maximum” for a setting. For example, our output voltage slew rate setting has a range of values to which it can be set. If you want to ensure the output voltage will change as quickly as possible, you want to set this to the maximum slew rate possible. Instead of looking up the specification for the maximum setting, you can use the appropriate SCPI command to set the slew rate to 9.9E37 and it will go to the maximum possible slew rate.

So when is a number not a number? When it is equal to 9.91E37!