Friday, May 29, 2015

How to calculate the accuracy of a power measurement

Electrical power in watts is never directly measured by any instrument; it is always calculated based on voltage and current measurements. The simplest example of this is with DC (unchanging) voltage and current: power in watts is simply the product of the DC voltage and DC current:
So the accuracy of the power measurement (which is calculated from the individual voltage and current measurements) is dependent on the accuracy of the individual V and I measurements.

For example, you might use a multimeter to make V and I measurements and calculate power. The accuracy of these individual measurements is typically specified as a percent of the reading plus a percent of the range which is an offset. (Note that “accuracy” here really means “inaccuracy” since we are calculating the error associated with the measurement.)

Let’s use an example of measuring 20 Vdc and 0.5 Adc from which we calculate the power to be 10 W. We want to know the error associated with this 10 W measurement. Looking up the specs for a typical multimeter (for example, the popular Keysight 34401A), we find the following 1-year specifications:

DC voltage accuracy (100 V range): 0.0045 % of reading + 0.0006 % of range
DC current accuracy (1 A range): 0.1 % of reading + 0.01% of range

The error (±) associated with the voltage measurement (20 V) is:
So when the measurement reading is 20.0000 V, the actual voltage could be any value between 19.9985 V and 20.0015 V since there is a 1.5 mV error associated with this reading.

The error (±) associated with the current measurement (0.5 A) is:
So when the measurement reading is 0.5 A, the actual current could be any value between 0.4994 A and 0.5006 A since there is a 0.6 mA error associated with this reading.

We can now do a worst-case calculation of the error associated with the calculated power measurement which is the product of the voltage and current. The lowest possible power value is the product of the lowest V and I values: 19.9985 V x 0.4994 A = 9.98725 W. The highest possible power value is product of the highest V and I values: 20.0015 V x 0.5006 A = 10.01275 W. So the error (±) associated with the 10 W power measurement is ± 12.75 mW.

The above is the brute-force method to determine the worst-case values. It can be shown that the percent of reading part of the power measurement error can be very closely approximated by the sum of the percent of reading errors for the V and I. Likewise, it can be shown that the offset part of the power measurement error can be very closely approximated by the sum of the voltage reading times the current offset error and the current reading times the voltage offset error:
Applying this equation to the example above for the 100 V and 1 A ranges at 20 V, 0.5 A:
So for 10 W, we get:
As you can see, this is the same result as produced by the brute-force approach. Isn’t it great when math works out the way you expect?!?!

In summary, the error associated with a power measurement calculated as the product of a voltage and current measurement has two parts just like the V and I errors: a % of reading part and an offset part. The % of reading part is closely approximated by adding the % of reading parts for the V and I measurements. The offset part is closely approximated by adding two products together: the voltage reading times the current offset error and the current reading times the voltage offset error. It’s as simple as that!

Should I use RS-232 or GPIB to communicate with my instrument?

Hi everyone,

I am writing this as I am preparing to go to the beach for a week.  My topic today will be short but hopefully useful.    We are going to talk about a subject that has been near and dear to my heart for the past 15 years, serial versus GPIB communication on our instruments.

Back in the days before LAN and USB became instrument standard interfaces, many of our products were designed with RS-232 serial ports in addition to GPIB.  RS-232 is standard on the 681xB AC Source/Analyzers, the E36xxA bench power supplies, the N330xA Electronic loads, as well as a few other products.

RS-232 is an interesting option for communication because it is free, most people have them standard on their computers, and you really only need to buy a reasonably priced cable.  The main drawbacks are the fact that you need to put it in remote mode yourself using the "SYST:REM" command, that reasonably priced cable has to be properly configured, and it is slower than GPIB.  The main drawbacks of GPIB is that it costs more and you need to purchase hardware.

I did some benchmarking this morning using my trusty 6811B AC Source/Analyzer.  I used the proper RS-232 cable and my Keysight 82357B USB to GPIB converter to connect to the 6811B.  I wrote a small program that measures the time to send a "*IDN?" command and receive a response.  The program looped 100 times and calculated the average time.  With GPIB, the average time to send and read back took about 7 ms.  With RS-232, the same send command and read back the response took about 50 ms.

So to answer my titular question, "Should I use RS-232 or GPIB to communicate with my instrument?", my answer in every instance would be to use GPIB.  I know that it is more expensive but you really get what you pay for in this instance.  GPIB is a much faster, more reliable way to communicate with your instruments.

Thanks for reading.  Let us know if you have any questions.

Friday, May 22, 2015

New performance options for the N6900A Advance Power System gives greater versatility for your test needs

Our N6900 and N7900 series Advanced Power System (APS) DC power supplies are some of our most sophisticated products, setting new levels of performance and capabilities on many fronts. They come in 1kW and 2kW power levels as shown in Figure 1 and can be grouped together to provide much greater power levels as needed.


Figure 1: N6900 and N7900 Advanced Power System 1kW and 2kW models

Most noteworthy is that these can be turned into full two-quadrant DC sources by connecting up the optional 1kW N7909A Power Dissipator (2 needed for 2kW units) providing 100% power sinking capability. This makes APS an excellent solution for battery, battery management and many alternative energy applications, where both sourcing and sinking power are needed.
  • The N6900 series DC power supplies are designed for ATE applications where high test throughput and high performance is critical.
  • The N7900 series dynamic DC power supplies are designed for ATE applications where high speed dynamic sourcing and measurement is needed, in additions to high performance.

A lot more about these products is covered in another post on our General Purpose Electronic Test Equipment (GEPTE) blog when they were first announced. This is a great resource for learning more about APS and can be accessed from the following link: “New Advanced Power System: Designed to Overcome Your Toughest Test Challenges”

If you are a regular visitor to the “Watt’s Up?” blog no doubt you have seen we have shared a lot about how to do things with the N6900 series and N7900 series APS to address a number of difficult test challenges. A lot of times it would have otherwise required additional equipment or custom hardware to accomplish these tasks. While many of these examples are suitable for the N6900 and N7900, a good number of times examples make use of the additional capabilities only available in the N7900 series.

In certain test situations the N6900 series APS would be a great solution and lower cost than the N7900 series, if only it also had a certain additional capability. To this end Keysight has recently announced four new performance options for the N6900 series APS to address a specific test need you may have, as follows:
  1. Accuracy Package (option 301): Adds a second seamless measurement range for current
  2. Measurement Enhancements (Option 302): Adds external data logging and voltage and current digitizers with programmable sample rates
  3. Source and Speed Enhancements (Option 303): Adds constant dwell arbitrary waveforms and output list capability, and faster up and down programming speed
  4. Disconnect and Polarity-Reversal Relays (Option 760 and 761): Provides galvanic isolation and allows output voltage to be switched between positive and negative values

 Additional details about the N6900 series APS and the four new performance options are available from the recent press release, available at the following link: “Keysight Technologies adds Versatile Performance Options to Industry’s Fastest Power Supplies”

With these new options you now have a spectrum of choices in the Advanced Power System product family to better address any test challenges you may be faced with!

Wednesday, May 20, 2015

Updates to USB provide higher power and faster charging

For those who regularly visit our blog here are already aware I do a fair amount of work with regard to test methodologies for optimizing battery life on mobile wireless devices. One directly related topic I have been actively investigating these past few months is the battery charging aspects for these devices. Recharging the battery on these devices takes a considerable amount of time; typically a couple of hours or longer, and it’s only been getting worse. However, there has been a lot of work, activity, and even new product developments that are making dramatic improvements in recharging your devices’ batteries in less time!

The USB port has become the universal connection for providing charging power for mobile devices. When initially available a USB port could provide up to 500 mA for general power for peripheral devices. It was recognized that this was also a convenient source for charging portable devices but that more current was needed. The USB BC (battery charging) standard was established which formalized charging initially for up to 1.5 amps at 5 volts.

This higher charging current and power was alright for mobile devices of a couple of generations ago, but today’s smart phones, tablets, and phablets are using much larger and higher capacity batteries. The end result is, because USB is 5 volts its power thus limited to 7.5W, that it can take several hours to recharge a device’s battery.  This can be very inconvenient if your battery goes dead during the day!

Simply increasing the USB current is not a total answer as this has limitations. First, the micro USB connectors on mobile devices are rated for no more than about 1.8 to 2 amps. To help on this front there is the new USB Type-C cable and connector specification released last year. The new type-C micro connectors are able to handle up to 3 amps and the standard connectors able to handle up to 5 amps. Higher current alone is not quite enough. Also issued last year was the new USB Power Delivery 2.0 specification. This specifies a system capable of providing up to 20 volts and 5 amps. This is more than order of magnitude improvement in power over the existing USB power. Long charging times due to power limitations will become a thing of the past.

The new USB power delivery voltages and currents are a discrete set of levels as shown in table 1. As can be seen the levels depend on the profile/port designation.


Table 1: USB power delivery 2.0 voltage and current levels

The cables and connectors of course need to be able to handle the given level of current and power.  In review of the standard a lot of work and effort has gone into providing this new capability while maintaining compatibility with the past as well. Thus for a new mobile device to take advantage of these higher power levels, it must be capable of negotiating with the charging power port to furnish it. At the same time, if an earlier generation mobile device is connected, it will only be able to get the default USB 5 volt level.


I’m looking forward to seeing this new USB power delivery put into wide-spread use in various innovative new products. Expect to see more about this topic in future posts from me here!

Thursday, April 30, 2015

When is a number not a number?

All of our power supplies measure their own output voltage and output current. These measured values are available to you from the front panel and over the bus. They may be displayed as an average value or a digitized waveform. Some products have different measurement ranges you can set that affect the accuracy of the measurement and the noise floor of the measurement. Of course, there is a maximum value that each measurement range is capable of measuring. So what happens to the reading if the actual output voltage or current exceeds the maximum value of the measurement range? What does the front panel show and what value do you get if you read it back over the bus?

Below is an example where I set the current measurement range to the 1 mA range on a Keysight N6781A Source/Measure Unit. I then forced more than 1 mA to flow out of the output. As you can see, the front panel indicates “Overload”. If you perform a current measurement and read the result back to your PC, you will get 9.91E37. This is a value defined in the SCPI (Standard Commands for Programmable Instruments) standard to mean “not a number” (NAN). Since Keysight products follow the SCPI standard, we return this number when a range is overloaded. This numeric value for NAN was chosen so that it can be represented as a 32-bit floating point number and is larger than anything expected to occur while using instrumentation. In addition to an overload condition on an instrument, NAN can also be used as the result when, for example, you divide zero by zero or subtract infinity from infinity.
This predefined number is also used when waveform data exceeds the maximum rating of a particular range. The screenshot below on the left shows data that does not overload the range. But when the range is changed and part of the waveform exceeds the maximum rating of the range, that part of the waveform data shows up on the screen in red and when returned to a PC, the value is the NAN value of 9.91E37.

Two other unique numbers defined by the SCPI standard are used to represent positive infinity and negative infinity. For positive infinity (INF), 9.9E37 is used. For negative infinity (NINF), -9.9E37 is used. These values can be used to mean “maximum” for a setting. For example, our output voltage slew rate setting has a range of values to which it can be set. If you want to ensure the output voltage will change as quickly as possible, you want to set this to the maximum slew rate possible. Instead of looking up the specification for the maximum setting, you can use the appropriate SCPI command to set the slew rate to 9.9E37 and it will go to the maximum possible slew rate.

So when is a number not a number? When it is equal to 9.91E37!

Let's See the Watchdog TImer in Action

Hi everybody!

It is the end of the month and time for my monthly blog post.

Quite some time ago, my buddy Gary mentioned our watchdog timer protection in a post.  Here is what he had to say:

The watchdog timer is a unique feature on some Agilent power supplies, such as the N6700 series. This feature looks for any interface bus activity (LAN, GPIB, or USB) and if no bus activity is detected by the power supply for a time that you set, the power supply output shuts down. This feature was inspired by one of our customers testing new chip designs. The engineer was running long-term reliability testing including heating and cooling of the chips. These tests would run for weeks or even months. A computer program was used to control the N6700 power supplies that were responsible for heating and cooling the chips. If the program hung up, it was possible to burn up the chips. So the engineer expressed an interest in having the power supply shut down its own outputs if no commands were received by the power supply for a length of time indicating that the program has stopped working properly. The watchdog timer allows you to set delay times from 1 to 3600 seconds. 

(For the whole post click here)

Since Gary wrote that post, we have released the N6900 and N7900 APS units that also include this useful feature.  What I wanted to do was show how to set it up, how to use it,and how to clear it so that everything is a bit more clear.   All of my programming examples in this post will be done using my APS with the VISA-COM IO Library in Visual Basic.

The setup is pretty easy:

        APS.WriteString("OUTP:PROT:WDOG:DEL 5")
        APS.WriteString("OUTP:PROT:WDOG ON")

This sets the watchdog delay to 5 seconds and enables it.  This means that if there is no IO activity (ie your computer hangs up) for 5 seconds, then the unit will go into protect and shut the output down.

Lets say that I have a program that performs a measurement around every second for a minute.  Here is the program:


        APS.WriteString("OUTP:PROT:WDOG:DEL 2")
        APS.WriteString("OUTP:PROT:WDOG ON")

        For i = 0 To 59
            APS.WriteString("MEAS:VOLT?")
            strResponse = APS.ReadString
            Threading.Thread.Sleep(1000)
        Next

        Threading.Thread.Sleep(3000)

        APS.WriteString("STAT:QUES:COND?")
        strResponse = APS.ReadString

 The watchdog delay is set for 2 second so while I run in the loop taking my measurements everything is working great.  After the 3 second wait at the end though, the 2 second watchdog timer comes into effect and the unit goes into the protect state and disables the output.  The response to the questionsable status query is 2048 which corresponds to bit 11 of the register which is defined as "Output is disabled by a watchdog timer protection".  This is the expected result.

My reccomendation to clear the watchdog timer would be to first disable the watchdog timer and then clear the protect.  You can then re-start the watchdog timer when you are ready.

        APS.WriteString("OUTP:PROT:WDOG OFF")
        APS.WriteString("OUTP:PROT:CLE")

The watchdog timer is a pretty cool feature that can perform a pretty useful task.  I hope that this blog post explains what it is and how to use it a bit more.

Tuesday, April 28, 2015

Optimizing a Power Supply’s Output Response Speed for Applications Demanding Higher Performance

Most basic performance power supplies are intended for just providing DC power and maintain a stable output for a wide range of load conditions. They often have lower output bandwidth to achieve this, with the following consequences:
  • Internally this means the feedback loop gain rolls off to zero at a lower frequency, providing relatively greater phase margin. Greater phase margin allows the power supply to remain stable for a wider range of loads, especially larger capacitive loads, when operating as a voltage source.
  • Externally this means the output moves slower; both when programming the output to a new voltage setting as well as when recovering from a step change in output load current.


While this is reasonably suited for fairly static DC powering requirements, greater dynamic output performance is often desirable for a number of more demanding applications, such as:
  • High throughput testing where the power supply’s output needs to change values quickly
  • Fast-slewing pulsed current loads where the transient voltage drop needs to be minimized
  • Applications where the power supply is used to generate power ARB waveforms


A number of things need to be done to a power supply so that it will have faster, higher performance output response speed. Primarily however, this is done by increasing its bandwidth, which means increasing its loop gain and pushing the loop gain crossover out to a higher frequency. The consequence of this the power supply’s stability can be more influenced by the load, especially larger capacitive loads.

To better accommodate a wide range of different loads many of our higher performance power supplies feature a programmable bandwidth or programmable output compensation controls. This allows the output to be set for higher output response speed for a given load, while maintaining stable operation at the same time. As one example our N7900A series Advanced Power System (APS) has a programmable output bandwidth control that can be set to Low, for maximum stability, or set to High1, for much greater output voltage response speed. This can be seen in the graph in Figure 1, taken from the APS user’s guide.


Figure 1: N7900A APS small signal resistive loading output voltage response

Low setting provides maximum stability and so it accommodates a wider range of capacitive loading. High 1 setting in comparison is stable for a smaller range of capacitive loading, but allowing greater response bandwidth. This can be seen in table 1 below, for the recommended capacitive loading for the N7900A APS, again taken from the APS user’s guide.


Table 1: N7900A APS recommended maximum capacitive loading

While a maximum capacitive value is shown for each of the different APS models for each of the two settings, this is not altogether as rigid and fixed as it may appear. What is not so obvious is this is based on the load remaining capacitive over a frequency range roughly comparable to the power supply’s response bandwidth or beyond. Because of this the capacitor’s ESR (equivalent series resistance) is an important factor. Beyond the corner frequency determined by the capacitor’s capacitance and ESR, the capacitor looks resistive. If this frequency is considerably lower than the power supply’s response bandwidth, then it has little to no effect on the power supply’s stability. This is the reason why the power supply is able to charge and discharge a super capacitor, even though its value is far greater than the capacitance limit given, and not run into stability problems, for example.

One last consideration for more demanding applications needing fast dynamic output changes, either when changing values or generating ARBs is the current needed for charging and discharging capacitive loads.  Capacitors increasingly become “short-circuits” to higher AC frequencies, requiring the power supply to be able to drive or sink very large currents in order to remain effective as a dynamic voltage source!

.

Tuesday, March 31, 2015

When is 64,000 points too many?

Hi everybody!

This month's blog post is based off a customer question that we received this month.  The question was around arbitrary waveforms (arbs), the number of points for the arb, and waveform fidelity.  I have spoken about arbs in the past: click me for Matt's old blog post.  Just to quickly reiterate, there are two options for arbs on the N6705 DC Power Analyzer and the N7900 Advanced power System. There is the Constant Dwell (CD) Arb that allows up to 64,000 point with a minimum Dwell time of 10 us per point and there is the standard List Arb that allows up to 512 points with a dwell as low as 1 us per point.

The question that we are trying to answer today is: When is 512 points more than 64,000 points?  It is an interesting question to think about.  It is definitely not true in cases where you have a non-repeating waveform.  The CD Arb will always be the preferred method there and will give you the best fidelity (smallest dwell times).

The answer is when you have long DC levels in your waveform.  Let's look at the proposed waveform below (please pardon the picture, I hand drew this on my tablet; also note that it is not to scale):


If you look at this waveform, the total time is 11.5 s.  It's a pretty simple waveform that goes from 4 V to 6 V with a 0.05 s ramp between the two values.  We need to pay attention to those times.

Lets with the math behind programming a CD Arb.  With a CD arb, there is a single dwell time so you basically sample the waveform 64000 times.  Lets use that to calculate a dwell time:

11.05 s/64000 = 172.66 us

This means that every point is going to last 172.66 us, no matter if it is in the constantly changing ramp or at a DC level.  This means that when the waveform is at 6 V for 10 s, you will use 57,918 points. That is 90% of your points just sitting at 6V!  For the 0.05 s ramp, you will only be using 290 points.  The ramp is where the waveform is actually changing but due to the nature of how the CD Arb works, you cannot increase the number of points allocated to the ramp.

Let's take a look at the 512 point list now.  We know that the first point of the list will be 4 V for 1 s and that the last point of the list will be 6 V for 10 s.  That leaves us with 510 points to do the 0.05 s ramp which results in s dwell time of 98 us.  This will give us more points in the ramp area and a better looking waveform overall.

That is all I have for this month.  Please feel free to use the comments if you'd like to get in touch with us.

Monday, March 30, 2015

Big resistors needed for high-power testing

Eighteen months ago, in September of 2013, Keysight (we were Agilent at the time) introduced a new high-power series of power supplies: the N8900 series of 5 kW, 10 kW, and 15 kW autoranging DC power supplies. I posted about those here.

Recently, our environmental lab was doing some testing on one of the 15 kW models that required them to use a low-noise load on the output. They have electronic loads that they can connect to the output to dissipate this level of power, but to be sure they were getting the lowest noise possible, they wanted to use resistors to load the output instead of the electronic loads. Since I was amused by the size of the resistors, I thought I’d capture the moment and share a picture with you.


The picture shows one of our R&D engineers in our environmental lab adjusting the output voltage of a 15 kW N8900 series power supply. Notice that these power supplies pack a lot of power (15 kW) in their small 3 U high package (the white box under the fan). The four big green things on the rack are resistors. The two on the top rack are each rated for 15 kW while the two on the lower rack are each rated for 20 kW. So that’s a total of 70 kW of resistive power! Clearly, these are not your father’s ¼ W resistors!

Even with 70 kW of power dissipation capability, and “only” 15 kW available from our power supply, a big fan was needed to keep the resistors cool…..or perhaps I should say “less hot” since they still get very hot. Of course, with an extra 15 kW of power being dissipated in the room, the room temperature was going up. But that was a good thing since we are still experiencing cold weather here in New Jersey despite the fact that spring started ten days ago. So the extra heat felt good!

Before we came out with the N8900 series of high-power supplies, Matt had posted about some things around his desk that included a 2500 W resistor (click here for his post). At that time, that was a high-power resistor. But now with these 15 kW supplies, you can see we had to go much bigger! And given that these supplies can be paralleled to 100 kW or more….well….I look forward to seeing what our R&D group and environment lab engineers come up with to do resistive load testing on those. Submarine-sized resistors, perhaps? We’ll see….

Monday, March 23, 2015

Use slew rate control to cleanly power up and reduce peak inrush current of your DUTs

Previously on Watt’s Up? a colleague wrote about how the current limit setting affects a power supply’s voltage response time (click here to review). In this posting he clearly shows how a low current limit setting can greatly slow down the output voltage turn on response time when powering up your DUT.

While this is generally true and good advice, especially for basic performance power supplies, there are additional things to consider when working with high performance power supplies models, as you will see.

Many basic performance power supplies tend to have larger output filter capacitors in order to achieve lower output noise performance. A disadvantage of having a large output capacitor is that it slows down the output voltage response speed of the power supply. Basic performance power supplies can have turn on response times on the order of a 100 milliseconds.

High performance power supplies operate by a somewhat different set of rules. In comparison to basic performance power supplies they typically have much smaller output capacitors and they are designed to have output turn on and turn off response times on the order of a millisecond or less.

However, absolute fastest is not always the best and that is why fast, high performance power supplies also usually incorporate an output voltage slew rate control as well. This allows you to optimize the output turn on and turn off speed for your particular application. This lets you take advantage of the faster output speed you have available, without it being overkill and cause other problems.

The two most common problems that arise when powering up and powering down many DUTs are related to charging and discharging the input filter capacitor incorporated into them. They are:
  • High peak inrush (and discharge) currents due to the high dV/dt slew rate being applied
  • Power supply CC-CV mode cross over issues resulting from the high peak inrush current


To illustrate, the turn on characteristic of our N6762A power supply was captured when powering up a load consisting of a 1,200 microfarad capacitor in parallel with a 10 ohm resistor. The N6762A was set to 10 volts and its voltage slew rate set to maximum.  This was captured using the N6762A’s digitizing voltage and current readback together with the 14585A software, shown in Figure 1.


Figure 1: N6762A power supply turn on response set to maximum slew rate into parallel RC load

The vertical markers have been placed at zero and maximum voltage points of the turn on ramp. The peak inrush current reaches 3.7 amps and the peak voltage overshoots to 11.06 volts, 10% over the 10 volt setting. The overshoot is a result of the power supply crossing over into current limit during the ramp up and allowing the voltage to rise to 11.06 volts before the voltage control loop regains control to bring the output back down to 10 volts. It also takes a little while for the voltage to settle after the peak overshoot. Both the overshoot voltage and peak inrush current can be problems when powering up a DUT. These occur as a result of having too fast of a voltage slew rate when powering the DUT.

To address the problem we then set the N6762A’s slew rate to a more acceptable value of 2,000 volts/second. The turn on voltage and current were again captured and are shown in Figure 2. As can be seen the voltage overshoot is eliminated and the inrush current has been reduced to a more moderate 3.3 amps.


Figure 2: N6762A power supply turn on response set to 2,000 V/s slew rate into parallel RC load

So in closing high performance power supplies have a significant advantage in their output response speed, in comparison to basic power supplies. And while faster is usually better, absolute fastest may not be best, and this applies to the output response time of power supplies as well! But by having the ability to set the output slew rate on high performance power supplies gives you the ability to optimize its speed for your given application, providing for the best possible outcome possible!

.

Wednesday, March 11, 2015

Comparing effects of using pulsed and steady state power to illuminate a high brightness LED

I was having a discussion here with a colleague about the merits of powering a high brightness LED (HBLED) using pulsed power versus using steady state DC power.

My opinion was: “Basically, amperes in proportionally equates to light flux out, so you will get about the same amount of illumination whether it is pulsed or DC.”

His argument was: “Because the pulses will be brighter, it’s possible the effective illumination that’s perceived will be brighter. Things appear to be continuous when discrete fixed images are updated at rates above thirty times a second, and that should apply to the pulsed illumination as well!”

I countered: “It will look the same and, if anything, will be less efficient when pulsed!”

So instead of continuing our debate we ran a quick experiment. I happened to have some HBLEDs so I hooked one up to an N6781A DC source measure module housed in an N6705B DC Power Analyzer sitting at my desk, shown in Figure 1. The N6781A has excellent current sourcing characteristics regardless whether it is DC or a dynamic waveform, making it a good choice for this experiment.


Figure 1: Powering up an HBLED

First we powered it up with a steady state DC current of 100 mA. At this level the HBLED had a forward voltage drop of 2.994 V and resulting power of 0.2994 W, as seen in Figure 2, captured using the companion 14585A control and analysis software.


Figure 2: Resulting HBLED voltage and power when powered with 100 mA steady state DC current

We then set the N6781A to deliver a pulsed current of 200 mA with a 50% duty cycle, so that its average current was 100 mA. The results were again captured using the 14585A software, as shown in Figure 3.


Figure 3: Resulting HBLED voltage and power when powered with 200 mA 50% DC pulsed current

Switching back and forth between steady state DC and pulsed currents, my colleague agreed, the brightness appeared to be comparable (just as I had expected!).  But something more interesting to note is the average current, voltage, and power. These values were obtained as shown in Figure 3 by placing the measurement markers over an integral number of waveform cycles. The average current was 100 mA, as expected. Note however that the average voltage is lower, at 2.7 V, while the average power is higher, at 0.3127 W! At first the lower average voltage together with higher average power would seem to be a contradiction. How can that be?

First, in case you did not notice, the product of the RMS voltage and RMS current are 0.3897 W which clearly does not match our average power value displayed. What, another contradiction? Why is that? Multiplying RMS voltage and RMS current will give you the average power for a linear resistive load but not for a non-linear load like a HBLED. The average power needs to be determined by taking an overall average of the power over time computed on a point-by-point basis, which is how it is done within the 14585A software as well as within our power products that digitize the voltage and current over time. Second, the average voltage is lower because it drops down towards zero during periods of zero current. However it is greater during the periods when 200 mA is being sourced through the HBLED and these are the times where power is being consumed.

So here, by using pulsed current, our losses ended up being 4.4% greater when powered by the comparable steady state current. These losses are mainly incurred as a result of greater resistive drop losses in the HBLED occurring at the higher current level.

There is supposed to be one benefit however of using pulsed power when powering HBLEDs. At different steady state DC current levels there is some shift in their output light spectrum. Using pulsed current provides dimming control while maintaining a constant light spectrum. This prevents minor color shifts at different illumination levels. Although I would probably never notice it!

Saturday, February 28, 2015

Synchronize Your Measurements with Your List Transients

Hi everybody!

My blog post this month is the result of a recent customer question.  The question was: how do you synchronize measurements with list transients?  The short answer is that you use the built in digitizer to generate enough points to sample the measurements over the entire transient.  The rest of this blog will provide the long answer.  The program that I am using here was written for a N6762A DC Power Module but the technique will work with any power supply that has a built in digitizer such as the Advanced Power System or any N6700 module with option 054.

For simplicity’s sake, we are going to use a 5 point list.  The voltage steps are 1 V, 2 V, 3 V, 4 V, and 5 V and the dwell times are 0.1 s, 0.2 s, 0.3 s, 0.4 s, and 0.5 s.  Let’s first set the list up (please note that all programming is done in VB.net with VISA-COM):


The next thing to do is to set up the measurement system.  We need to figure out the total number of points that we need measure so that we can cover the entire transient.  The first thing that we need to do is to calculate the total time of the list transient (you can even do this in your program):


The total time of our transient is 1.5 s.  Now we need to use this to figure out the number of points. I am going to choose a measurement interval of 40.96 us.  This means that we want to take a measurement every 40.96 us for 15 s.  To get the total number of points, you need to divide the total transient time by the measurement time interval:

I’m going to round down and use 36,621 points.  I’m also going to tell the power supply to use the binary data format because as we know from my previous blog posts, this is the fastest way to read back data.   Here is the code to set up the digitizer:


We will set our trigger source to bus for both the transient system and the acquire system:


Next we initiate both systems:


Once the initiate is complete, we send a trigger:

This will start both the list transient and the digitizer.  After everything is completed, we can fetch our measured voltage array:


This array will have all of our measurements.

I hope that this has been useful, have a good month everyone.


Thursday, February 26, 2015

When measurements and mathematics agree, I’m happy!

I have been an electrical engineer my entire career which will span 35 years in June (yikes….I’m too young to be this old!). Despite all of that time, plus the 4 years of undergraduate study before that and 3 years to get my MSEE at night while working full time during the day, I am still amused by some simple engineering principles. When the measurements I make in the real world completely agree with the hard-core theoretical mathematics I learned in school, I am amused.  Perhaps this should simply be expected (it is), but for some reason, I am still delighted when it happens. I recently had one of those simple experiences that I want to share with you today.

I was exploring some of the features on our new Keysight PA2201A IntegraVision power analyzer to better understand its operation and the applications for this new line of power measurement instrumentation. I had a simple desk lamp with a 100 W incandescent light bulb plugged into the wall outlet (120 Vac, 60 Hz here in the United States) and ran the voltage and current to the power analyzer. Given that the bulb presents a nearly pure resistive load to the sinusoidal voltage, as expected, the current was also a sine wave and in phase with the voltage. The power analyzer easily displays these measured waveforms.

What I never had an opportunity to see before was a visualization of the power waveform. For some reason, in all of my 35 years working in the power business, I never looked at a power waveform for a simple resistive load. Voltage? Sure! Current? Many times!! But power? Nope. The IntegraVision power analyzer shows voltage, current, and power waveforms as a typical display (this can be configured in quite a few other ways as well). So I was looking at the waveforms shown below.


The first thing I noticed about the power waveform was that it was sinusoidal and it never went below zero. This quickly made sense to me since I did consider the bulb to be purely resistive meaning it is consuming power 100% of the time, so all of the power flowing to the bulb had to be positive. The bulb is never pushing power back to the AC line as would happen with a reactive load especially for a purely reactive load such as a pure capacitor or inductor. If the load (the bulb) was not purely resistive, some of the power waveform would have dipped below the zero power line indicating that sometimes the load was absorbing power and sometimes it was providing power back to the line.

The next thing I noticed about the power waveform was that its phase was synchronized with the voltage and current, and it showed twice the frequency. Again, this quickly made sense since the power is simply the product of the voltage and the current [P(t) = V(t) * I(t)]. So the positive peaks have to line up (they do), the zero crossings of the voltage and current have to align with zero watts on the power waveform (they do), and the negative peaks in the voltage and current have to line up with another positive peak in the power since a negative voltage times a negative current yields a positive power (they do). This, of course, was the reason for the power waveform being twice the frequency of the voltage and current waveforms.

So I next decided to check the math behind the waveforms. I admit….I had to look up the trigonometric identity, but it was worth it! Since both the voltage and current waveforms are sine waves, and the power is the product of these, I looked up the identity for sine squared:
The voltage is a 120 Vrms, 60 Hz sine wave:
The current is 99.8 VA / Vrms = 0.832 Arms:
The power is V(t) * I(t):
Applying the above sine squared identity:
So you can see there is a 99.8 W fixed offset in the power waveform from which a cosine function is subtracted. The frequency of the cosine is 120 Hz (double the 60 Hz voltage and current waveforms). All of this completely agrees with the power waveform measured by the IntegraVision power analyzer. I am always thrilled when the math agrees with the measurements no matter how simple it is! How about you?

Tuesday, February 24, 2015

Two New Keysight Source Measure Units (SMUs) for Battery Powered Device and Functional Test

Over the past few years here on “Watt’s Up?” I have posted several articles and application pieces on performing battery drain analysis for optimizing run time on mobile wireless devices. The key product we provide for this application space is the N6781A 20V, +/-3A, 20W source measure module for battery drain analysis. A second related product we offer is the N6782A 20V, +/-3A, 20W source measure module for functional test. The N6782A has a few less key features used for battery drain analysis but is otherwise the same as the N6781A. As a result the N6782A is preferred product for testing many of the components used in mobile devices, where the extra battery drain analysis features are not needed. These products are pictured in Figure 1. While at first glance they may appear the same, one thing to note is the N6781A has an extra connector which is independent voltmeter input. This is used for performing a battery run-down test, one of a number of aspects of performing battery drain analysis. Details on these two SMUs can be found on by clicking on: N6781A product page.  N6782A product page,


Figure 1: Keysight N6781A SMU for battery drain analysis and N6782A for functional test

These products have greatly helped customers through their combination of very high performance specialized sourcing and measurement capabilities tailored for addressing the unique test challenges posed by mobile wireless devices and their components. However, things have continued to evolve (don’t they always!). Today’s mobile devices, like smart phones, tablets and phablets, have an amazing amount of capabilities to address all kinds of applications. However, their power consumption has grown considerably as a result. They are now utilizing much larger batteries to support this greater power consumption in order to maintain reasonably acceptable battery run-time. Optimizing battery life continues to be a critical need when developing these products. With their higher power however, there is in turn a greater need for higher power SMUs to power them during test and development. In response we have just added two new higher power SMUs to this family; the N6785A 20V, +/-8A, 80W source measure module for battery drain analysis and the N6785A 20V, +/-8A, 80W source measure module for functional test. These products are pictured in Figure 2. Details on these two new higher power SMUs can be found on by clicking on: N6785A product page.  N6786A product page.


Figure 2: Keysight N6785A SMU for battery drain analysis and N6786A for functional test

A press release went out about these two new SMUs yesterday; Click here to view. With their greater current and power capability, customers developing and producing these advanced mobile wireless devices and their components now have a way to test them to their fullest, not being encumbered by power limitations of lower power SMUs.

This is exciting to me having been working within the industry for quite some time now, helping customers increase battery life by improving how their devices make more efficient use of the battery’s energy. A key part of this has been by using our existing solutions for battery drain analysis to provide critical insights on how their devices are making use of the battery’s energy.  There is a lot of innovation in the industry to make mobile wireless devices operate with even greater efficiency at these higher power and current levels. There is no other choice if they are going to be successful. Likewise, it is great to see continuing to play a key role in this trend in making it a success!

.

Monday, February 9, 2015

Consider using an electronic load for generating fast, high-power current pulses

Often there is the need for generating high-power current pulses, typically of short duration, and having rise and fall times on the order of microseconds. This is a common need when testing many types of power semiconductors, for example.

When looking for a DC power supply capable of generating very fast, high-power current pulses, one will find there are not a lot of options readily available that are capable of addressing their needs. There are specialized products dedicated for specific applications like this; an example of this is Keysight’s B1505A purpose-built semiconductor test equipment. They are capable of generating extremely fast, high-power current pulses.

Apart from specialized products however, DC power supplies generally to not offer this kind of speed when operating in a constant current mode (or current priority mode). One exception that comes to mind that we provide is our N6782A and N6782A DC source measure modules. They can create fast current pulses having just a couple of microseconds of rise and fall time. However, they are limited to 20V, 3A, and 20W of output. Most of the higher power, more general-purpose DC sources are not able to generate these kinds of fast, high-power current pulses and most are really more optimized to operate as voltage sources.

One alternative to consider for generating fast, high-power current pulses when working with general-purpose test equipment is to use an electronic load. You may initially say to yourself “an electronic load is for drawing pulses of current, not sourcing them!” but when coupled to a standard DC power supply operating as a voltage source, the setup is able to source fast, high-power current pulses. Most electronic loads are designed to have very fast current response. To illustrate this, I helped one customer needing to test their high brightness LED (HBLED) arrays with fast pulses of current. This was accomplished with the setup shown in Figure 1.


Figure 1: Load setup generating fast, high power current pulses for LED array testing

In this setup the power supply operates as a fixed, static voltage source. The power supply’s output voltage is set to the combined total of the full voltage needed to drive the HBLED array at full current plus the minimum voltage needed for the electronic load. The minimum voltage required for the electronic load is when it conducting maximum current and most of the power supply voltage is then applied across the HBLED array. The electronic load’s required minimum voltage is that which supports its operation in its linear range and maintains full dynamic response characteristics. In the case of Keysight electronic loads this minimum voltage for linear dynamic operation is 3 volts.  Conversely the maximum voltage required for the electronic load is when it drops down to minimum current level, where the power supply’s voltage is instead now being dropped across the electronic load instead of the HBLED array. Note that the electronic load may need to maintain a very small amount of bleed current to maintain linear operation in order to provide truly fast rise and fall times. In this way the electronic load is able to regulate the current across the full range with excellent dynamic response. This can be seen in Figure 2 where we were able to achieve approximately 15 microsecond rise time right from the start.


Figure 2: Pulsed current rise time in HBLED array

One advantage of this setup is the wide range of voltage and power that can be furnished to the DUT using a relatively low power electronic load. A common characteristic of electronic loads is that they can dissipate a given amount of power over an extended range of current and voltage. When the electronic load is at maximum current it is at minimum voltage. Conversely when it is near or at zero current it is then at its maximum voltage. In both cases there is only a small amount of power that the electronic load needs to dissipate. For an HBLED array it does not conduct a lot of current until it reaches about 75% of its full operating voltage. As a result the electronic load does not see a lot of power even on a transient basis. For this particular situation we chose to use the Keysight N3303A 240V, 10A, 250W electronic load. This gave a wide range of voltage, current, and power for testing a comparably wide range of different HBLED array assemblies.

So next time you need to source fast, high-power current pulses, you may want to think “load” instead of “source”!


Friday, January 30, 2015

Using the Passthrough Command in IVI drivers

Hi everybody!

I was working on a customer question yesterday and I thought that it would make an enlightening blog post.  We have a feature for our IVI-COM and IVI-C drivers that allows you to directly send SCPI commands to your instrument.  This is really useful if you run into a situation where you think there is a function is missing from our driver or you run into something unexpected.  Overall, it is pretty easy to use once you know where to find it.

Let's look at the IVI-COM driver first.  You can find the passthrough in the Systems Interface under the IO property.  One you get to the IO level, you can just use the standard VISA-COM commands to send commands to the instrument and read responses back.  For my little example here I am just going to send a voltage measurement and read back the response:

In the code above, agDrvr is the name I gave to the instrument when I initialized it.

We also provide an IVI-C driver.  The IVI-C driver also has a passthrough command that is just a little more complicated than the IVI-COM version.. To send SCPI commands, you use the AgN67xx_SystemWrite function and to read data back you would use the AgN67xx_SystemRead function.  The same example as above would look like this:

In this IVI-C code:
status is where the IVI-C driver will report an error if there is an unsuccessful call 
session is the handle that I gave to this instrument when I initialized
32 was my best guess at the size of the response string.  I like to overestimate.
strResp is where I want the response to be stored
respSize is the actual size of the response and is returned by the program

All in all it's not too difficult and will definitely come in handy.  

That all I have for you this month.  As always, let us know if you have any questions.

Matt


Thursday, January 29, 2015

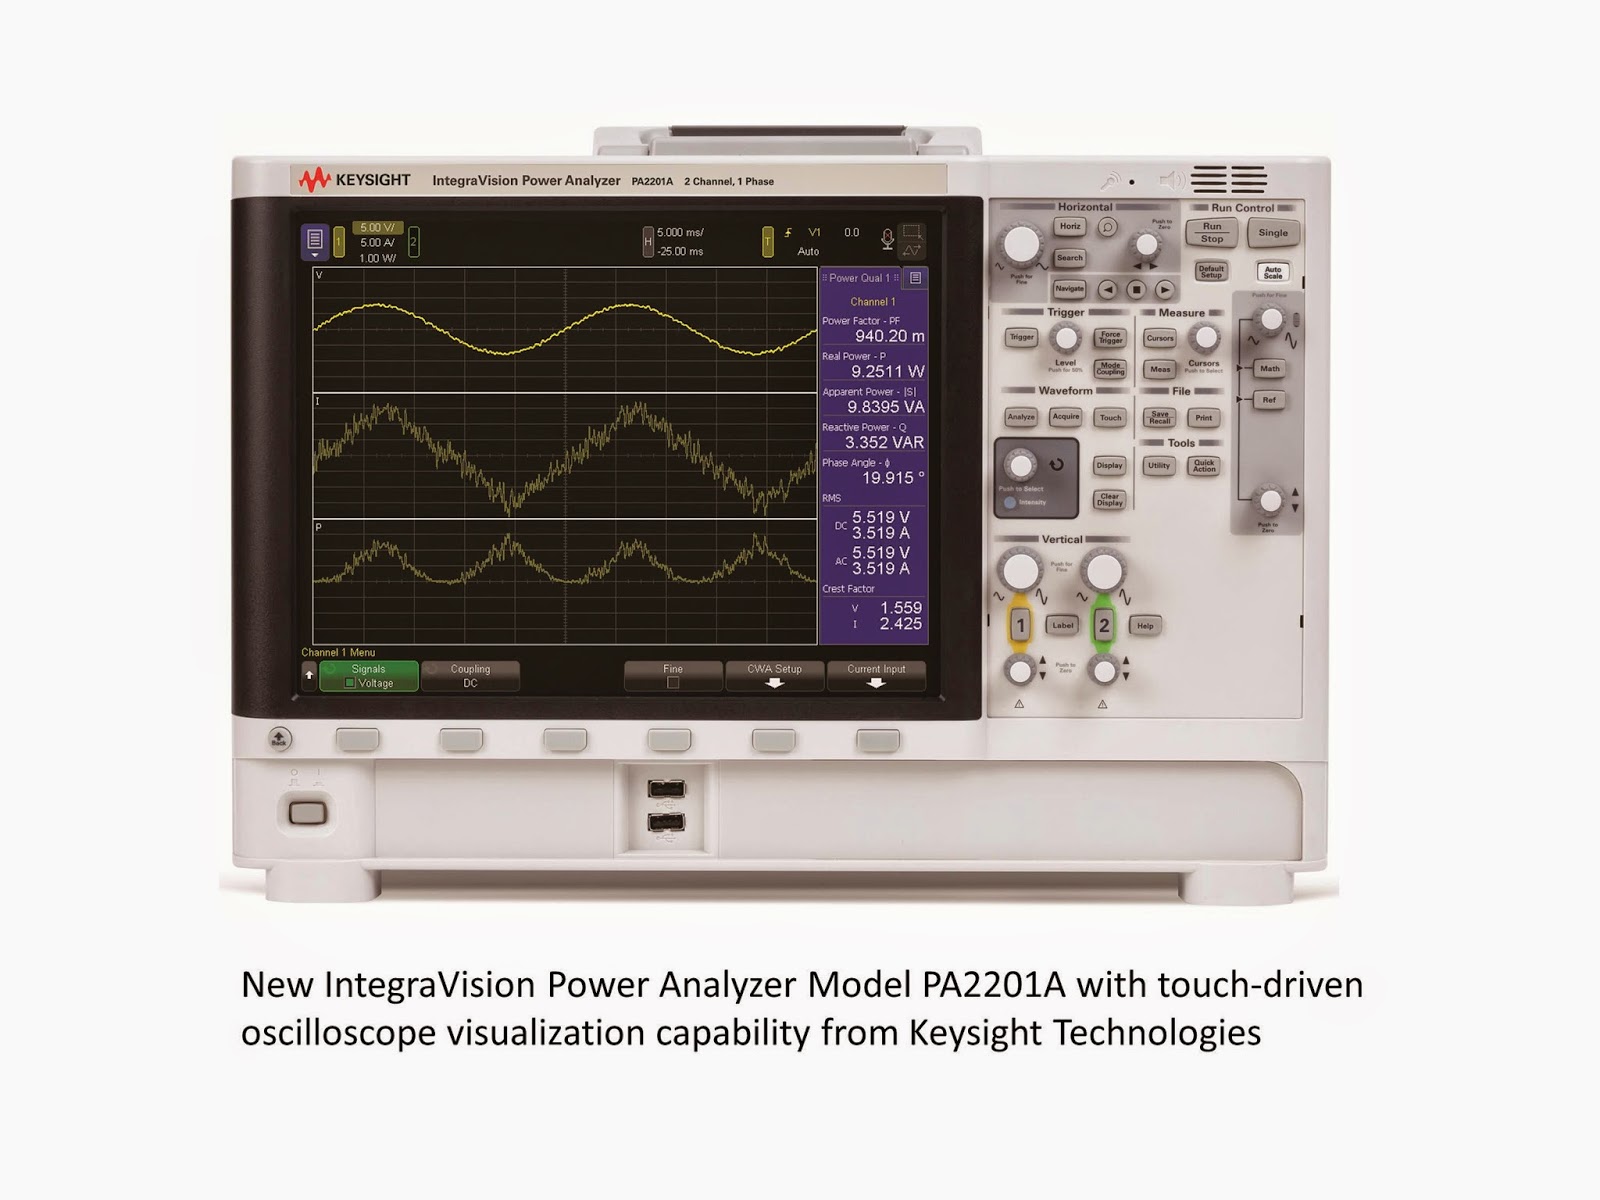
New Keysight Power Analyzer called IntegraVision

Back on June 23, 2014, I posted about the last Agilent power products to ever be announced. At that time, we had not yet officially changed our name from Agilent to Keysight. So the AC6800 AC sources we released on that date were released under the Agilent name, soon to be rebranded to Keysight. Well, today, I am announcing the first new Keysight power product: the Keysight Technologies IntegraVision Power Analyzer Model PA2201A.


A press release went out about these products earlier today: click here to view. We here at the Power & Energy Division of Keysight have been involved in power products for decades, and of course, Keysight has an oscilloscope division with commensurate experience producing scopes. I consider the new IntegraVision power analyzers to be a combination of the vast experience of our engineers from these two disciplines combining a power analyzer and an oscilloscope. The power analyzer will enable you to accurately measure parameters such as watts, VA, VAR, power factor, crest factor, efficiency, watt-hours, amp-hours, and harmonics while the oscilloscope will allow you to visualize in real time the voltage, current, and power waveforms that are important in your design.

I am very exciting about this new line of power measurement instruments! I have been working for HP/Agilent/Keysight for nearly 35 years now and have always worked with power products during my career. One of my favorite product families to support has been the older sophisticated 6800 AC Power Source/Analyzers (not to be confused with the newer basic AC6800 series mentioned in the first paragraph above). The older AC sources can produce sine waves, square waves, and arbitrary waveforms (for tests such as cycle dropout tests) as well as measure most of the power analyzer parameters mentioned above since they have a power analyzer built into the AC source. But now the new IntegraVision power analyzer goes well beyond the capabilities of the power measurements built into our AC sources. Adding time-based measurements like watt-hours and amp-hours opens up many more energy measurement application areas for this new product and the visual waveform measurements are a huge benefit when doing things like characterizing AC inrush current or product response to AC line disturbances. I am delighted with the performance of the touch-screen on this product – it will help you gain faster insight into your designs plus it just makes using the product fun! With 0.05% basic accuracy, 5 MSample/second 16-bit digitization, and inputs isolated to 1000 V, the IntegraVision power analyzer really is a superb product for power consumption and power conversion applications. Click here for the IntegraVision web page with links to the individual products.

So the next time you need a power analyzer with great accuracy and you also want to see the power waveforms related to your application, be sure to look at Keysight’s new IntegraVision Power Analyzer Model PA2201A. I’m sure you will not be disappointed! And look here for future posts about some of the interesting applications for this product, such as AC power line disturbance measurements and micro-inverter efficiency measurements. Suggest some of your own power measurements for me to make and I’ll see what I can do for a future post for you!

Wednesday, January 7, 2015

A new current measurement methodology: It’s all about counting the electrons going by!

One thing near and dear to us here at the Power and Energy Division is making accurate current measurements. What exactly is current? It’s basically the flow of electric charge per unit of time. In a conductor it’s the flow of electrons through it per unit of time. 

The ampere is the fundamental unit of current in coulombs per second, which equates to 6.241x10¹⁸ electrons per second. Accurate current measurement is one of the core values of virtually all of our products. Some of the precision SMU products can measure down to femtoamp (fA) levels (10-15 amps). This is where we tend to muse that we’re getting down to the levels where we’re virtually counting the individual electrons going by.

While there are a few different ways of measuring current, by far the most common is to measure the voltage drop across a resistive shunt. With careful design this provides the most accurate means of current measurement. There are a lot of non-obvious factors that can introduce unexpected errors that many are not aware of, leading them to believe they have better accuracy than what it really is. A good discussion of what it takes to truly make accurate current measurements was covered in a previous posting “How to make more accurate current measurements”(click here to review). We go through great pains in addressing these things in our products in order to provide accurate and repeatable measurements.

Unlike the volt and the ohm, which have quantum standards for their electrical units, the ampere instead relies on the standards for the volt and ohm for measurement, as a quantum standard for the ampere that directly relates it back to charge is still lacking. However, that may change in the not too distant future. A group of scientists were awarded the Helmholtz Prize in metrology for realization of the measurement of the ampere based on fundamental constants. Basically they’ve created an electron charge pump that moves a small, fixed quantity of electrons under control by a clock. You can say they’re literally “counting the electrons as they go by”. This could become the new SI standard reference for current measurement. To me this is very fascinating to find out about. More can be learned on this from the following link to the press release “Helmholtz Prize for the “new” ampere”(click here to review).  I am curious to see how this all plays out in the long run. Maybe it will lead to yet another, and better, way to make more accurate current measurements in products we all use today in our work in electronics!

Wednesday, December 31, 2014

Why is the Programming Resolution Supplemental Characteristic Listed as an Average?

Hello everyone!

Happy New Year!  This is our last post of 2014 so we wanted to wish all of our readers a Happy New Year.  Today I am going to talk about a question that I have been asked a few times lately.  In many of our power supplies, we list our Programming Resolution as an average number.  Many people want to know why we do it this way.

Look at the below snippet from our 664xA DC Power Supplies Supplemental Characteristics:


You can see that that it is clearly stated as an average.

The simple answer to this question is that this is because of calibration.

The more complex answer is that we use a DAC to control the output setting of the power supply.  A certain number of DAC counts is going to represent zero to full scale on the output of the supply.  For simplicity's sake, lets assume that we are using a 12 bit DAC for a power supply that goes to fifty volts.

In an ideal world where calibration is not necessary:
A 12 bit DAC gives us 2^12 or 4096 total counts.
The step size (programming resolution) of the 50 volt power supply would be 50/4096 or 0.0122 volts.

We do not live in an ideal world though so we have to disregard some DAC counts because of how the unit calibrates. We also generally let you program a little bit above the maximum settings (usually something like 2%).  Zero volts is not going to be zero DAC Counts and 50 V is not going to be 4096 DAC counts.  For our example, lets say that the minimum that we disregard 20 counts at the top and bottom (40 total counts) and the maximum we disregard is 120 counts (240 total counts) at the top and bottom.  In this scenario:

Minimum step size = 50/(4096-40) = 0.0123 V
Maximum step size = 50/(4096-120) = 0.0130 V

For our Supplemental Characteristic, we would take the average of those 2 numbers.   This gives us 0.01265 V.

The big question is how would I know what the programming resolution is for my particular unit.  I spent about half of yesterday trying to figure that out and I'm still working that out myself.  The best solution that I have right now is to hook a DMM to the output and slowly increment my output to see when it flips to a new setting.  I need to experiment on this though.  If any readers have a better idea, please let us know in the comments.  The fact of the matter is that the error is pretty small and to be safe, any error due to being in between DAC counts is included in our Programming Accuracy specification.

Well that is all for 2014. I hope that everyone has a safe and happy 2015.  See you next year!

Matt